

Trends in labour market inactivity for caring purposes


In the decade leading up to the coronavirus pandemic, rising labour market participation was a key driver of economic growth, partly offsetting the effects of the post-financial crisis slowdown in labour productivity. One of the most important components of this increase in economic activity rates was the rising participation rate of mothers of young children and an associated decline in the number of individuals citing ‘looking after family/home’1 as their reason for being out of the labour force. However, since mid-2020 the consistent downwards trend in inactivity for caring purposes appears to have come to an end. This article examines the reasons for this and what it might imply for our forecast for overall labour force participation.2
Trends in inactivity due to looking after family/home


As discussed in more detail in our March 2023 Economic and fiscal outlook and July 2023 Fiscal risks and sustainability report, the rate of labour market inactivity fell steadily for just over a decade leading up to the pandemic. From July 2011 to February 2020, the level of inactivity fell by 1.2 million from over 9.5 million to just under 8.4 million, and the inactivity rate fell by 3.3 percentage points from 23.5 per cent to 20.2 per cent, their lowest levels since records began. Within this overall pre-pandemic trend, falling inactivity among carers played an important role. Since the end of 2015, inactivity for this reason has fallen by 710,000 (31 per cent) and drove much of the overall fall in inactivity, especially after retirement-related inactivity stopped falling and sickness-related inactivity started to increase (Chart 1).
However, since the start of the pandemic, labour market inactivity has risen. Between February 2020 and its peak in July 2022, total inactivity rose by 642,000, before falling back to leave the increase since the start of the pandemic at 410,000 in July 2023 (the latest outturn). The main driver of the increase has been the rise in inactivity due to long-term sickness. However, an arresting of the downward trend in inactivity for caring purposes has also made an important contribution to the overall dynamics of the inactive population.
Inactivity among those citing caring as their main reason for being out of the labour market continued its pre-pandemic downwards trend until mid-2020 then started to rise from mid-2021 (Chart 1). Inactivity for caring purposes has started falling again in recent months, leaving it 285,000 lower than immediately before the pandemic and at an all-time low of 1.5 million in July 2023. This means that, despite this recent fall, over the last few years, inactivity for caring purposes has not been exerting the same kind of downward pressure on overall inactivity rates that it was prior to the pandemic.
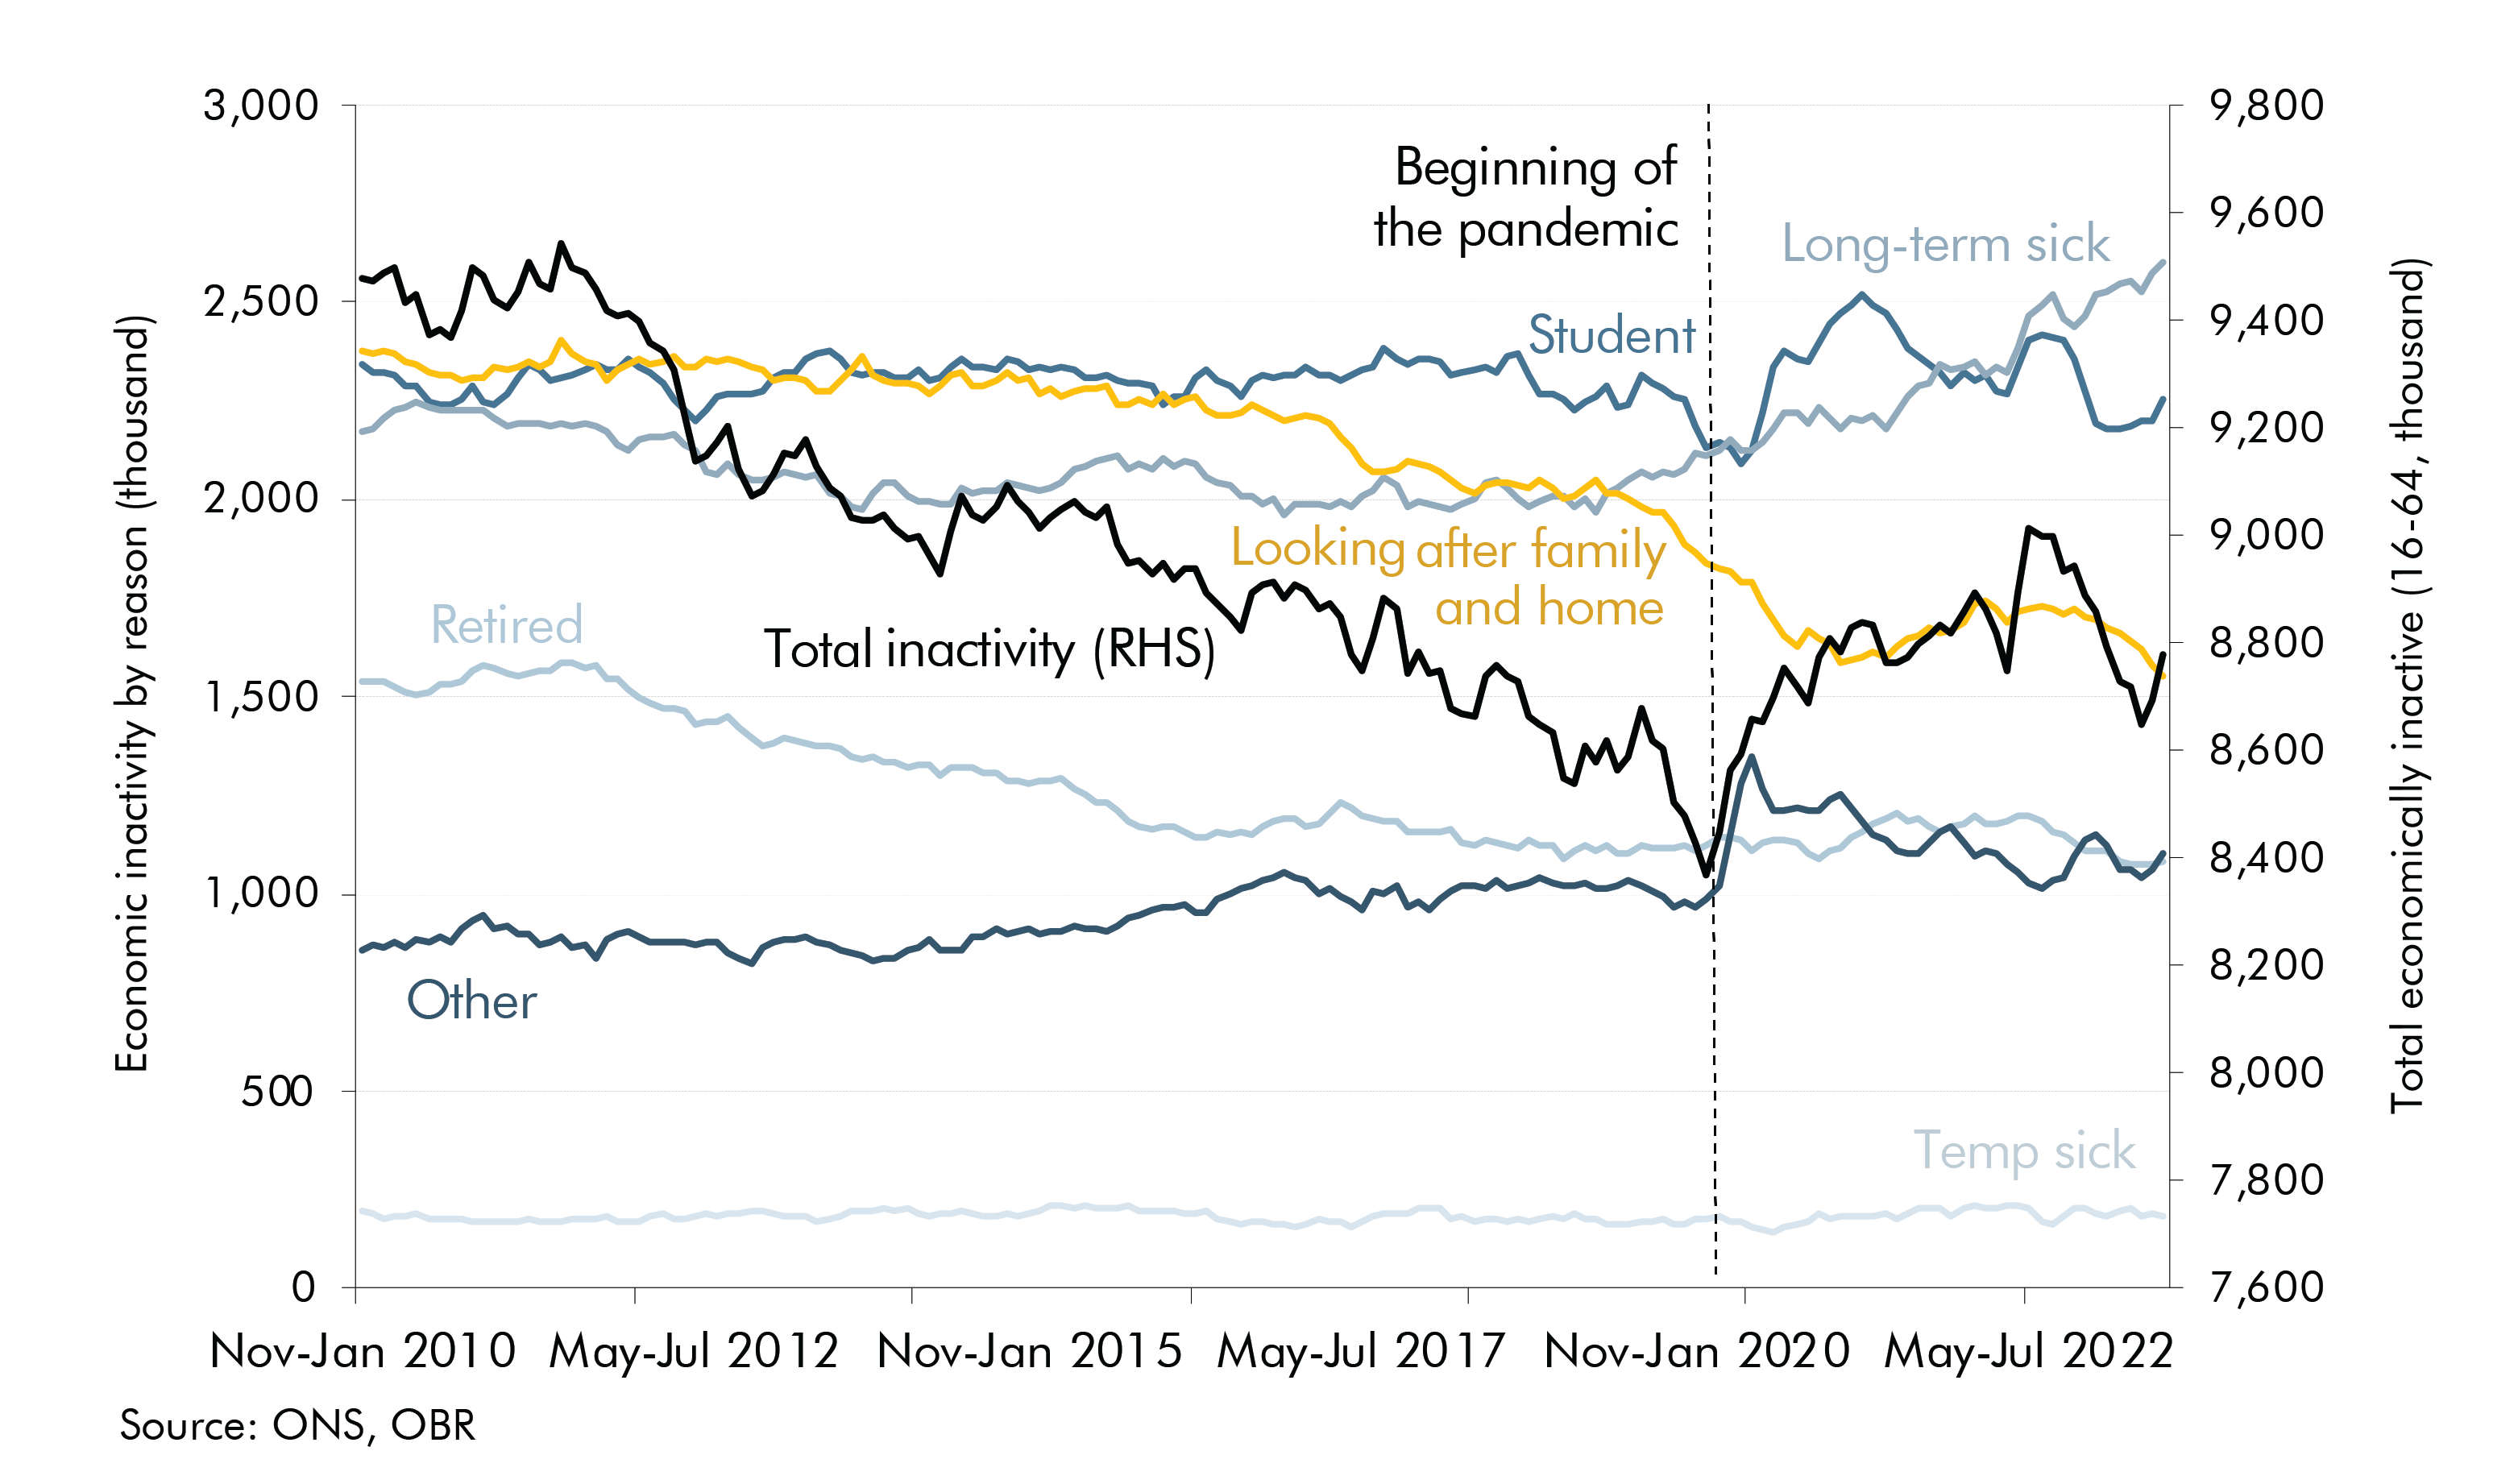
Chart 1: Inactivity by reason
Since the start of the pandemic, inactivity for caring purposes has stopped falling while inactivity for health reasons has risen.

Trends contributing to past falls in inactivity due to looking after family/home


Inactivity due to looking after family/home can be divided into two broad groups: those looking after children (usually a parent but sometimes a grandparent or other relative) and those who are inactive due to other responsibilities (such as caring for a partner or parent). The fall in inactivity due to looking after family/home since 2010 has been almost entirely driven by those with dependents under 18 falling from 1.9 million to 1.2 million. Amongst those with no dependent children, inactivity has remained relatively stable at around 500,000. This suggests that changes in caring for children has been the key driver of the overall trend in inactivity due to looking after family/home.
The fall in inactivity due to childcare since 2010 has been driven by two main factors (Chart 2), which we look at in more detail in the next section:
- A significant fall in the birth rate over the past decade. Between 2010 and 2021 the number of live births in the UK decreased by around 98,000 (14 per cent), while the Total Fertility Rate (TFR),3 a measure of the birth-rate that adjusts for changes in the size and age structure of the female population, has decreased from 1.94 to 1.55 (20.1 per cent). This is below the average replacement rate of 2.08 children that is required to ensure long-term “natural” replacement of the population. There was a brief and slight reversal in this trend in 2021 with an increase in the total number of births by around 11,000 (2 per cent), but this was likely driven by late birth registrations from the pandemic inflating the number of registrations in 2021. In 2022 the number of live births fell again, by 19,000 (3 per cent). Following the modest spike in births between 2000 and 2009, this decline in the birth rate since 2010 is a continuation of a longer-term trend caused by a number of factors including medical advances such as lower child mortality, increased contraception access, and changing social norms. More recently, the rise in costs associated with childrearing, including housing costs, may be contributing to the continued fall in the birth rate. This fall in the number of births has, in itself, meant there are fewer people exiting the workforce to look after children, resulting in a fall in inactivity due to looking after family/home.
- A rise in the participation rate of mothers. We focus on mothers as the paternal participation rate has remained consistent over the past 10 years (at around 91 per cent) and is significantly higher than the maternal participation rate (around 71 per cent). Between 2010 and 2020 mothers with children of all ages have seen rises in their participation rates, but with sharper increases for those with younger children. Between 2017 and 2019 there was an especially rapid increase in the participation rate of mothers with children aged 3 to 5 years old from 65 to 71 per cent, which may have been due to the introduction of the 30 hours free childcare policy. Since 2020, the improvement in the participation rate of mothers of young children has stalled. This may have been due to the impact of the pandemic, as virtual schooling and a lower availability of childcare may have meant fewer mothers were able to enter the workforce or had to drop out of work. However, this stagnation continued in 2022-23, which could be linked to some combination of the after-effects of the pandemic, the rising cost of childcare, or modest rise in unemployment.
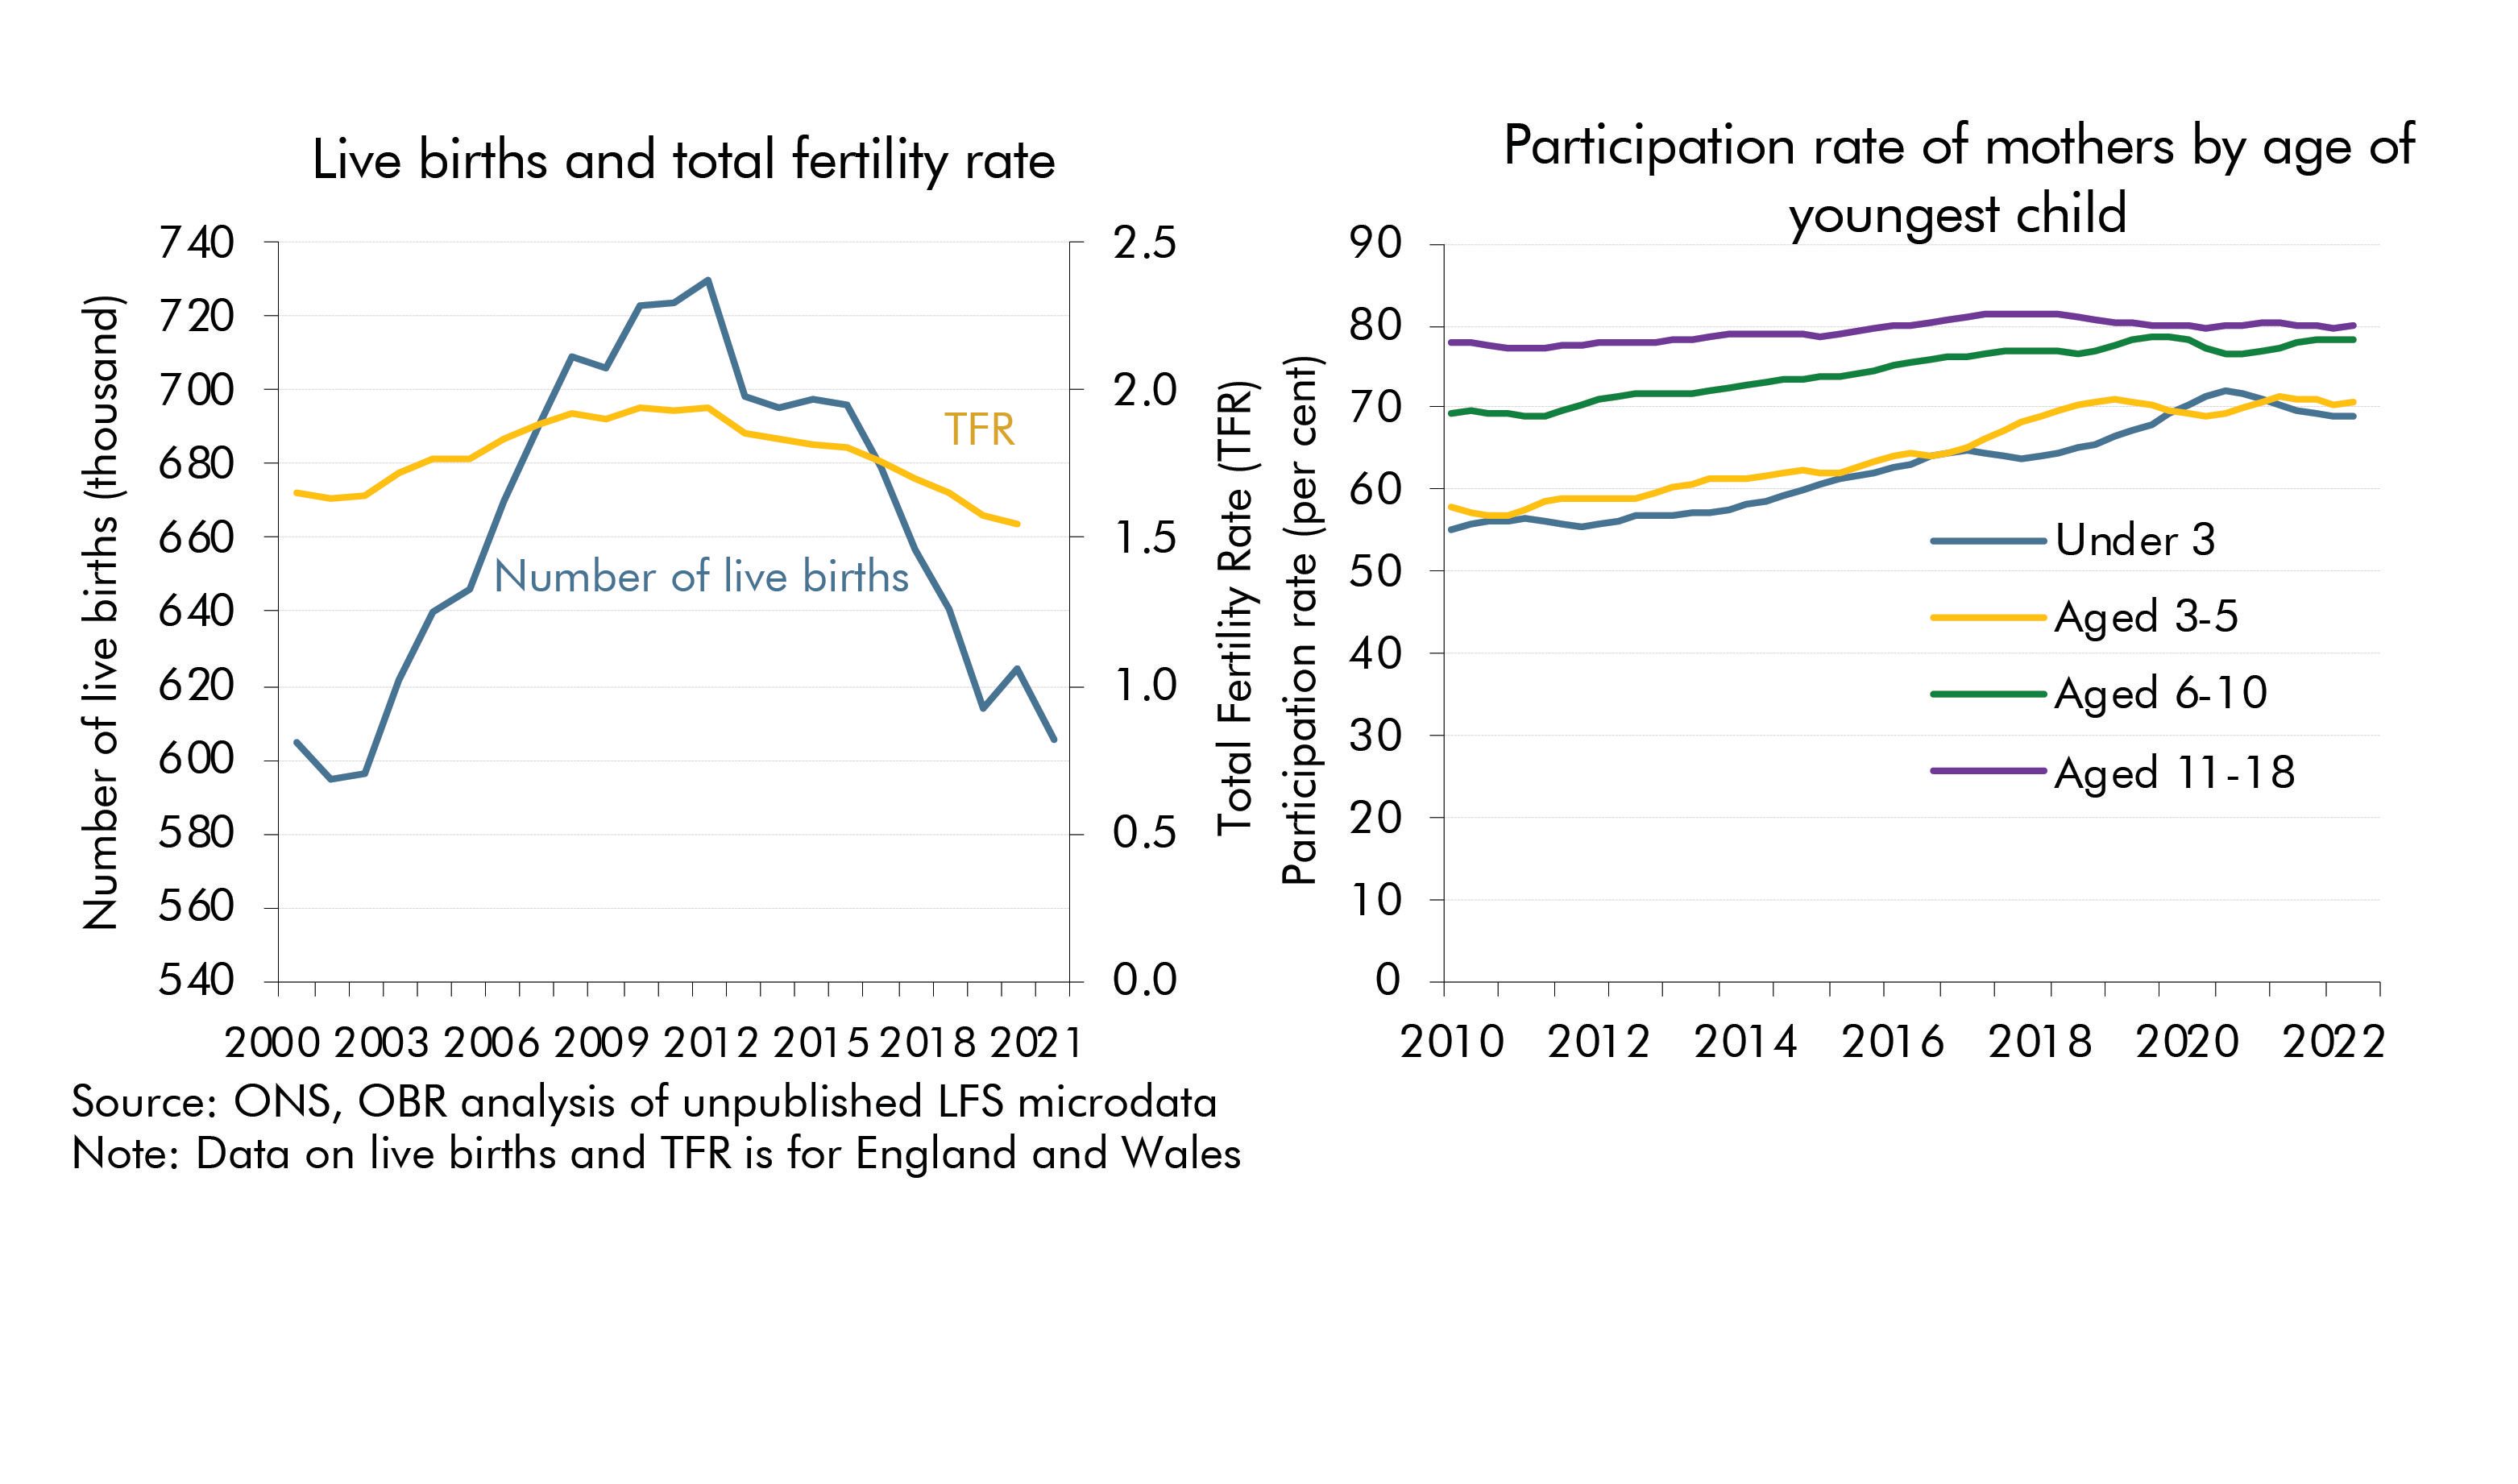
Chart 2: Trends in births and maternal participation
The birth rate has steadily declined over time, whilst the maternal participation rate has risen, which together have reduced inactivity due to caring for children.
Decomposing the change in inactivity due to looking after family/home

Understanding the relative contribution of these two different trends, the falling number of births and rising maternal participation, toward the overall number of people inactive for caring purposes is key to forecasting future rates of labour market participation. Chart 3 provides an illustrative decomposition of the change in inactivity due to looking after family/home into: (i) changes in the number of children; (ii) changes in the participation rates of mothers; and (iii) other factors including changes in numbers of people caring for adults. Given that, as shown in Chart 2 above, nearly all of the change in the employment rate of mothers has been among those with children under the age of 11, we focus on this group. The illustrative decomposition shows that:
- Inactivity among mothers of children under 11 fell by around 810,000 between 2010-11 and 2022-23, more than accounting for the overall fall in inactivity for caring reasons which fell by 630,000 over this period.
- Between 2010-11 to 2019-20, this fall in inactivity was driven entirely by increases in the participation rate of women with children under 11. This is likely linked to the aforementioned introduction of the 30 hours free childcare policy and changing social norms. However, this was slightly offset by an increase in the number of children under 11, which is due to a ‘population bulge’ created by the increase in birth rates from 2000 to 2011.
- From 2019-20 to 2022-23, the participation rate of mothers with children under 11 was broadly constant. Therefore, during this period, the further decline in inactivity due to looking after family/home has been driven entirely by the falling birth rate reducing the total number of parents with young children.
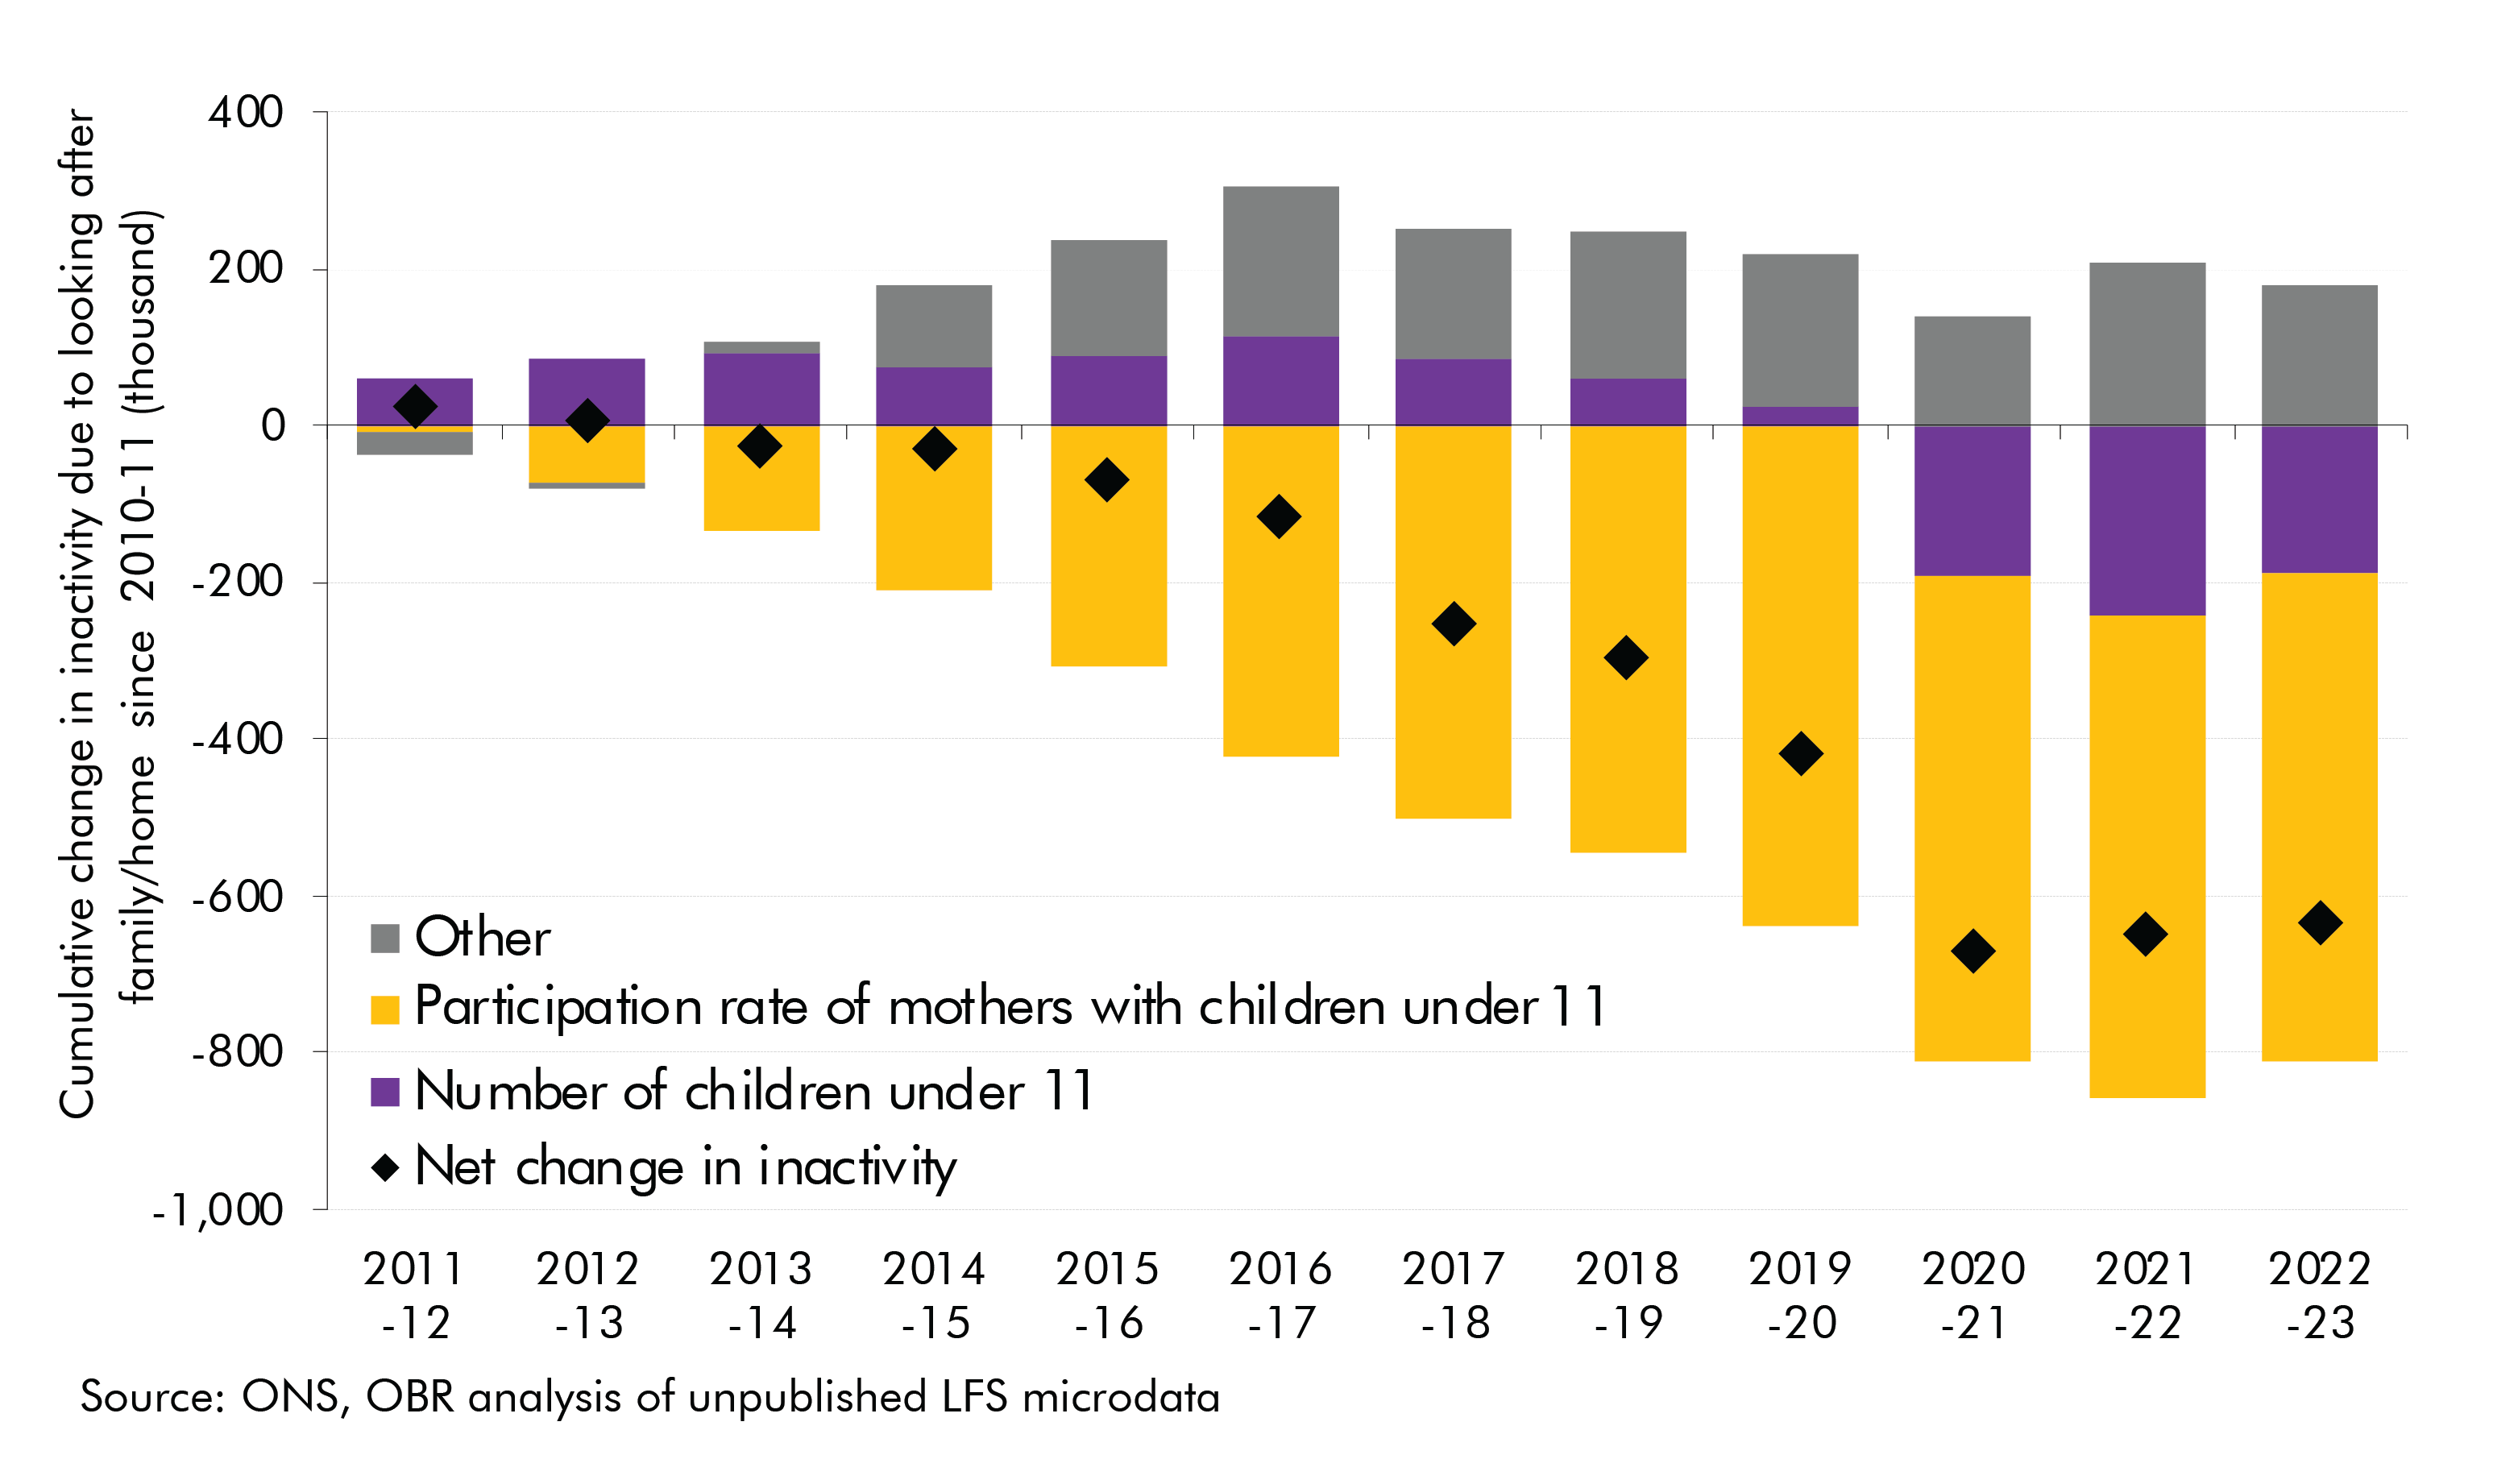
Chart 3: Decomposing the change in inactivity due to looking after family/home
The fall in inactivity due to looking after family/home has historically been due to increases in the maternal participation rate, but more recently has been driven by a fall in the birth rate.
Scenarios for future inactivity due to looking after family/home


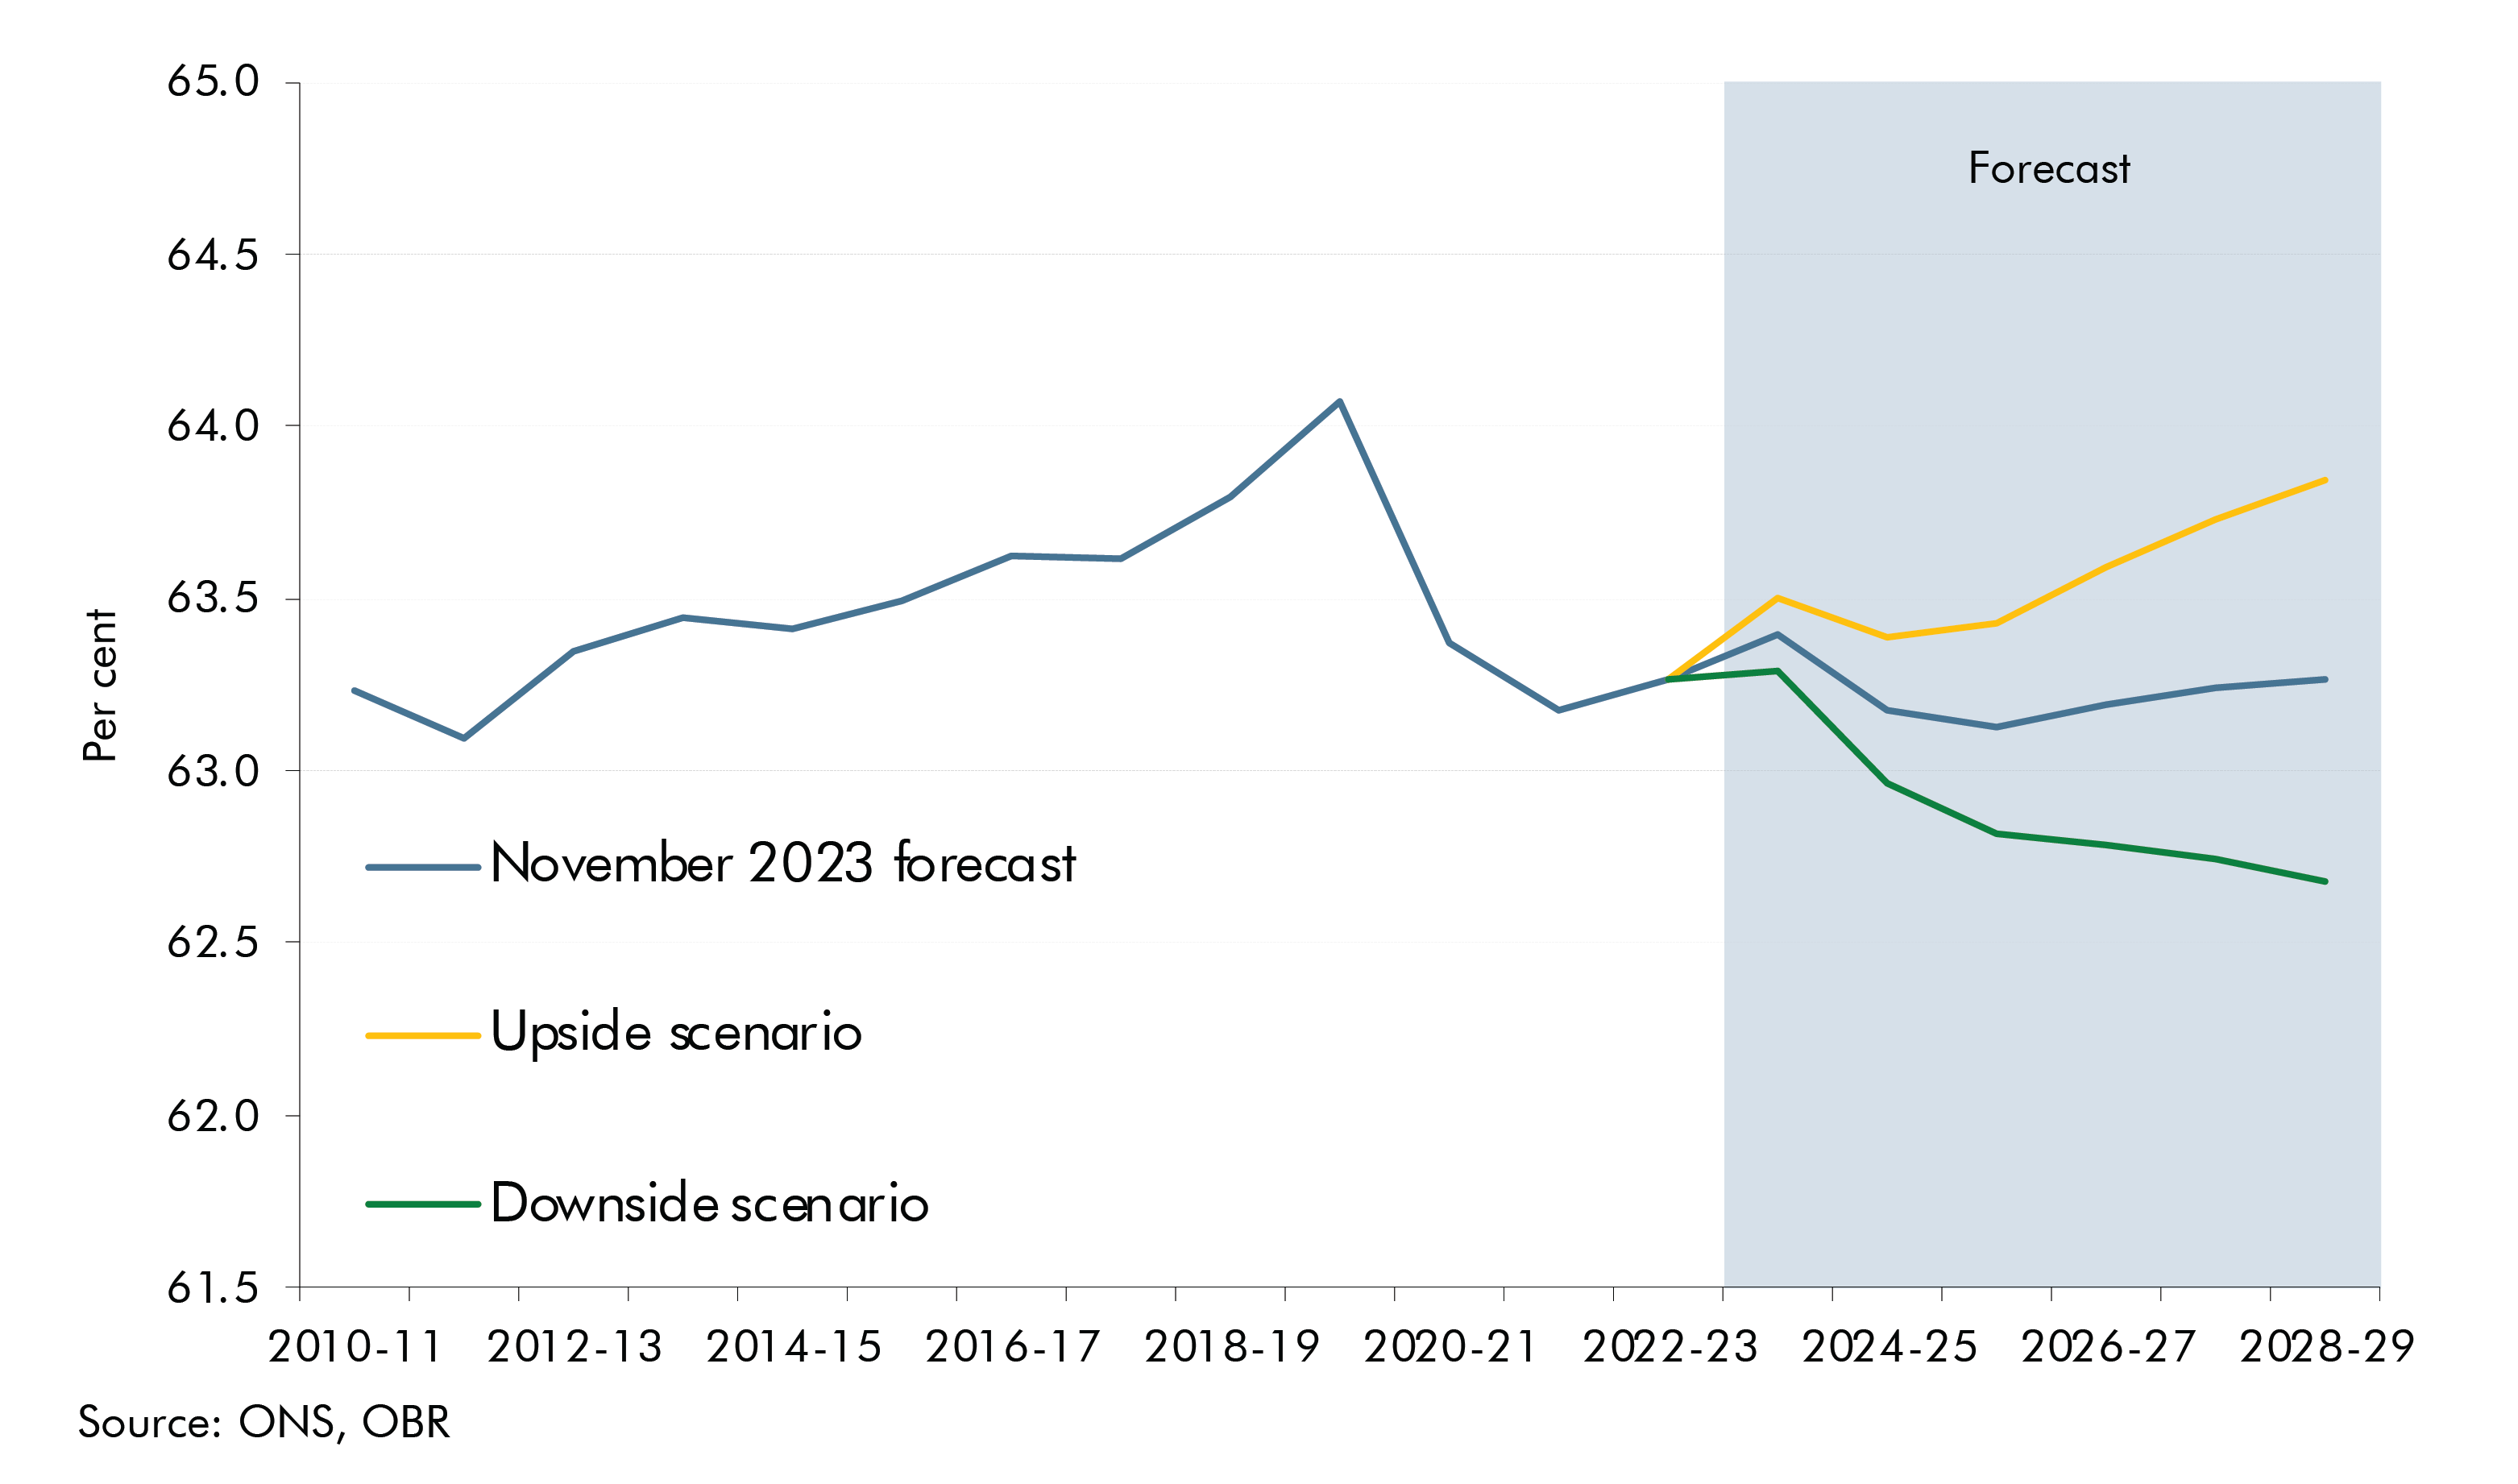
The future trajectory of activity rates of parents of young children is an important component of our overall labour force forecast. In our November 2023 forecast, we expect inactivity due to caring responsibilities to fall as the recent decline in the birth rate means the share of children in the population is set to fall in the medium term (based on the ONS population projections we use in our forecast). We also expect the March 2023 Budget expansion of childcare to boost participation among parents of young children by 60,000 people by 2027-28. For our overall participation forecast, this is partially offset by other factors, including the aging of the population and rising levels of reported ill-health among the working population, which mean participation falls back in the near-term before rising marginally in the medium term (Chart 4).
Given the preceding analysis showed changes in the inactivity rate of mothers of young children was a key driver of the overall change in inactivity due to caring responsibilities, we look at two illustrative scenarios. In both, we use ONS population projections4 and vary the participation rate of mothers of children under 11. Chart 4 shows the scenarios:
- In the upside scenario, we assume the participation rate of mothers of young children rises by 7 percentage points above our central forecast by 2028-29. This would be broadly consistent with a resumption in the rising participation trend among this group of mothers in the five years before the pandemic. Compared to our November 2023 forecast, this adds around 330,000 people to the labour force and boosts the overall participation rate by 0.6 percentage points. Assuming these new entrants to the labour force work around half the hours of the average worker this could boost potential output by ½ a per cent by the forecast horizon.5
- In the downside scenario, we assume the participation rate of mothers of young children falls by 7 percentage points below our central forecast by 2028-29, undoing just over half of the rise in the decade before the pandemic. The impact of this scenario compared to our November 2023 forecast is symmetric to the upside, reducing the labour force by 330,000 people and the overall participation rate by 0.6 percentage points. Based on the same assumption about average hours as the upside scenario, this would reduce potential output by ½ a per cent in 2028-29.
Chart 4: Total participation rate: November 2023 forecast and scenarios
While much recent attention has focused on rising inactivity rates for health reasons, the above scenarios illustrate that the future trend in inactivity due to looking after family/home is similarly important to the economic and fiscal outlook. This scenario focuses only on the impacts of maternal participation, and there are a wide range of other factors that could drive changes in overall inactivity. For example, there is a risk that increases in those caring for an adult as the population ages and social care struggles to keep up with rising demand could offset the fall in caring for children. We will aim to explore recent trends in, and the outlook for, inactivity due to caring for an adult in a future publication.
Acknowledgements
We are grateful for the engagement, expertise, and insights from various OBR staff members in compiling this article.
Downloads