Income tax and the earnings distribution

Income tax is the UK’s single biggest tax stream, making up a quarter of total public sector receipts in 2024-25 (£302.7 billion or 10.9 per cent of GDP). Given the progressive nature of the income tax system (the more you earn, the higher the average rate of tax you pay) getting the distribution of income right is a key judgement for our income tax forecast. Around 60 per cent of income tax revenue comes from the top 10 per cent of earners, and 30 per cent from the top 1 per cent, so earnings changes at the top of the income scale can cause big shifts in the tax take.
Since the pandemic, income tax outturns have generally been higher than our forecasts, and higher than recent aggregate and average earnings data would have suggested.1 Since March 2023 we have therefore refined our forecast methods for PAYE income tax to make use of extensive analysis undertaken by HMRC on differential growth across the earnings distribution. In this article, we set out:
- how we put the PAYE income tax forecast together in our biannual Economic and fiscal outlooks;
- how new distributional analysis of earnings informs and improves our forecast; and
- what our latest forecast assumes about earnings growth across the distribution.2
How we forecast income tax

To forecast PAYE income tax for employees we take our forecast for total pay and:
1. apply an average tax rate (ATR) to the portion of any increase (or decrease) in total pay driven by more (or fewer) people in work; and
2. apply an average marginal tax rate (MTR) to the portion of any increase (or decrease) in total pay driven by higher (or lower) average earnings.3
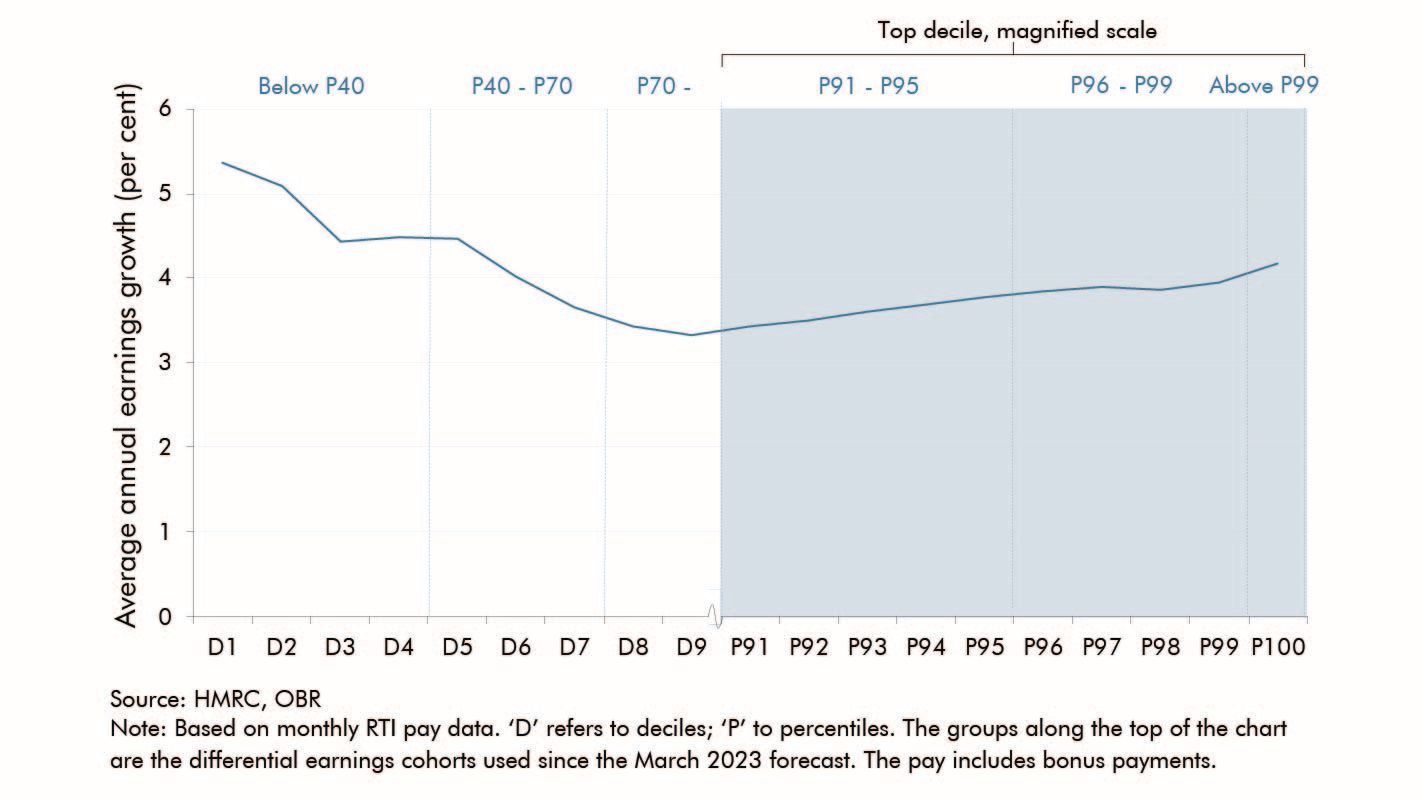
To calculate the appropriate MTR we need to know how earnings growth is distributed across income levels. That is because, for a given level of average pay growth, the more that accrues to those with higher earnings, the higher the proportion that will be paid in tax. Our forecast therefore divides employees into cohorts (shown at the top of Chart 1) of varying sizes (e.g., percentiles, deciles) based on their earnings and their contribution to tax receipts (hence our more detailed focus on the top 10 per cent of earners). We then forecast how earnings in each group are likely to change over the coming years, resulting in an earnings growth differential for each group (defined as earnings growth for the group compared to the mean earnings growth for the whole population).
Exploring earnings growth across the distribution

Previously our income tax modelling and analysis used the Survey of Personal Incomes (SPI) – HMRC’s administrative dataset of individuals who could be liable to UK tax (currently 2019-20-based). The availability, since July 2014, of HMRC’s PAYE RTI earnings data has allowed us to track more closely (and on a more timely basis) the tax base of PAYE income tax in particular.4
This analysis shows that in recent years, earnings growth has been highest at the bottom of the distribution.5 As shown in Chart 1, annual growth in the bottom decile has averaged around 1.6 percentage points above the fifth decile since 2014. Earnings growth is weakest between the seventh (broadly equivalent to median full-time earnings) and ninth deciles. Earnings growth then picks up as you move through the top decile. Growth for the top 1 per cent is around 0.3 percentage points lower than at the fifth decile, but 0.6 percentage points higher than at the seventh decile. (Note that these figures will likely not equate to the actual earnings growth that individuals have experienced. People move around – and into and out of – the distribution from year to year as jobs change and careers progress, so growth at a particular percentile between two periods of time will likely be comparing different sets of individuals.)
Chart 1: Growth in annualised pay between 2014-15 and 2022-23 by decile (and percentile for the top 10 per cent).
The causes of this 'U-shape' of earnings growth in recent years are likely to include:
- At the bottom end of the scale, the introduction of the national living wage (NLW) in 2016 and its rising value relative to typical hourly earnings since. The NLW has risen from around 59 per cent of median hourly earnings in 2016 to around 67 per cent by 2024. This is likely to have pushed up the wages of lower earners (both directly and via spillover effects to those earning just above the NLW). While the lowest hourly earners are not the same as those with the lowest annual pay due to differences in working hours, they are concentrated towards the bottom of the annual pay distribution.
- At the very top of the distribution, possible drivers include the resilience of highly-paid sectors during the pandemic (particularly IT, finance, and professional) and bonuses. Since 2018, around 80 per cent of bonuses have gone to the top 1 per cent of earners, with the vast majority of the remainder going to the rest of the top ten.6
- Ongoing ‘job polarisation’ may offer a further explanation. This theory suggests that the jobs most at threat from technological progress are the ‘routine’ cognitive and manual tasks typically found in the middle of the wage distribution, leading to rising relative demand for low-paid service jobs and high-paid professional and managerial jobs. Autor and Dorn show this pattern occurring in the US labour market over 1980-2005, while Goos and Manning show the same for the UK between 1975 and 1999, although with stronger growth at the top end than bottom end in the UK than the patterns seen in the US. While more recent research suggests that UK job polarisation provides only partial insights into UK wage trends, it appears plausible that ongoing rising demand for non-routine lower-paid service jobs (especially in occupations like social care) and higher-paid professional and managerial jobs may have contributed to recent growth patterns across the UK earnings distribution.
How we have improved our forecast

Prior to our March 2023 forecast, we had assumed that differences in earnings growth would narrow over time leading to equal earnings growth across the distribution by the end of the forecast horizon. But the persistence of a ‘U-shaped’ pattern of earnings growth in recent years led us to decide in our March 2023 forecast (and those since) to assume that earnings growth at the very top and bottom of the distribution would remain higher than average earnings growth throughout the forecast period.
We apply these differentials stripping out bonuses (i.e. we strip out implied bonuses from the data and add the bonus forecast back in afterwards), in order that we can make separate judgements on bonus growth. Prior to our November 2023 forecast, we grew bonuses in line with total earnings – in effect assuming that the proportion of total wages and salaries made up of bonuses remained constant across the forecast period (we made occasional adjustments to this basic approach based on in-year evidence of sectoral bonus strength7). Since November 2023, the forecast for bonuses in financial and professional sectors has been linked with share prices in the quarter just prior to the bonus months, based on extensive analysis of bonus trends using sectoral receipts data going back to 1999 and RTI data between 2014 and 2022-23.
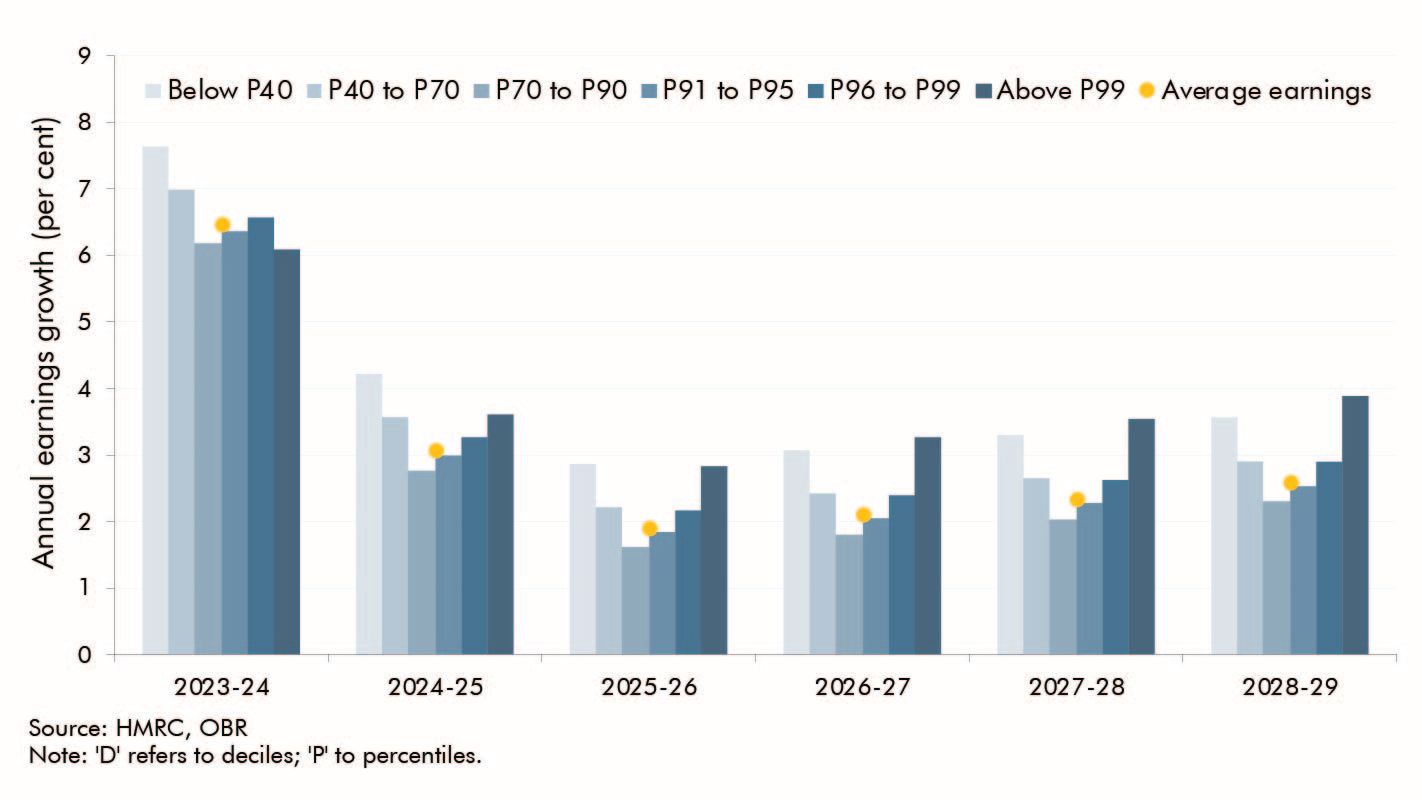
Bringing these methodological improvements together, Chart 2 shows the pattern of earnings growth by earnings cohort that underpins our March 2024 forecast. Earnings growth in the top percentile and the bottom four deciles is forecast to be an average of 1.0 percentage points a year higher than the mean each year. Relative to our previous forecast approach, based on a flattening rate of earnings growth across the distribution and bonuses grown in line with total earnings, these changes to our forecasting methods have increased the PAYE income tax receipts forecast by roughly £2.4 billion (0.8 per cent) by 2028-29.
Implications for future analysis

These recent forecasting changes show that what happens to the top 1 per cent of earners is very important for our income tax forecasts, given the highly progressive tax schedule. Relatedly, they demonstrate the sensitivity of our forecasts to what we assume about bonus growth, a point further underscored by the performance of our latest forecast against recent monthly outturns. So these will remain core areas of interest as we review patterns of earnings growth across the distribution and improve the way we forecast income tax at each fiscal event.
Chart 2: March 2024 forecast of earnings growth by cohort
Acknowledgements
We are grateful for the engagement, expertise, and insights from HMRC staff members Ruth Townsend and Mark Spivack and OBR staff colleagues in compiling this article.
Downloads
Income tax and the earnings distribution (article PDF)


