

300 years of UK public finance data

Our new historical public finances database contains 300 years of tax, spending, borrowing and debt data. This article tells the story of government borrowing and debt since 1700 and how the level and composition of tax and spending have evolved over this period.
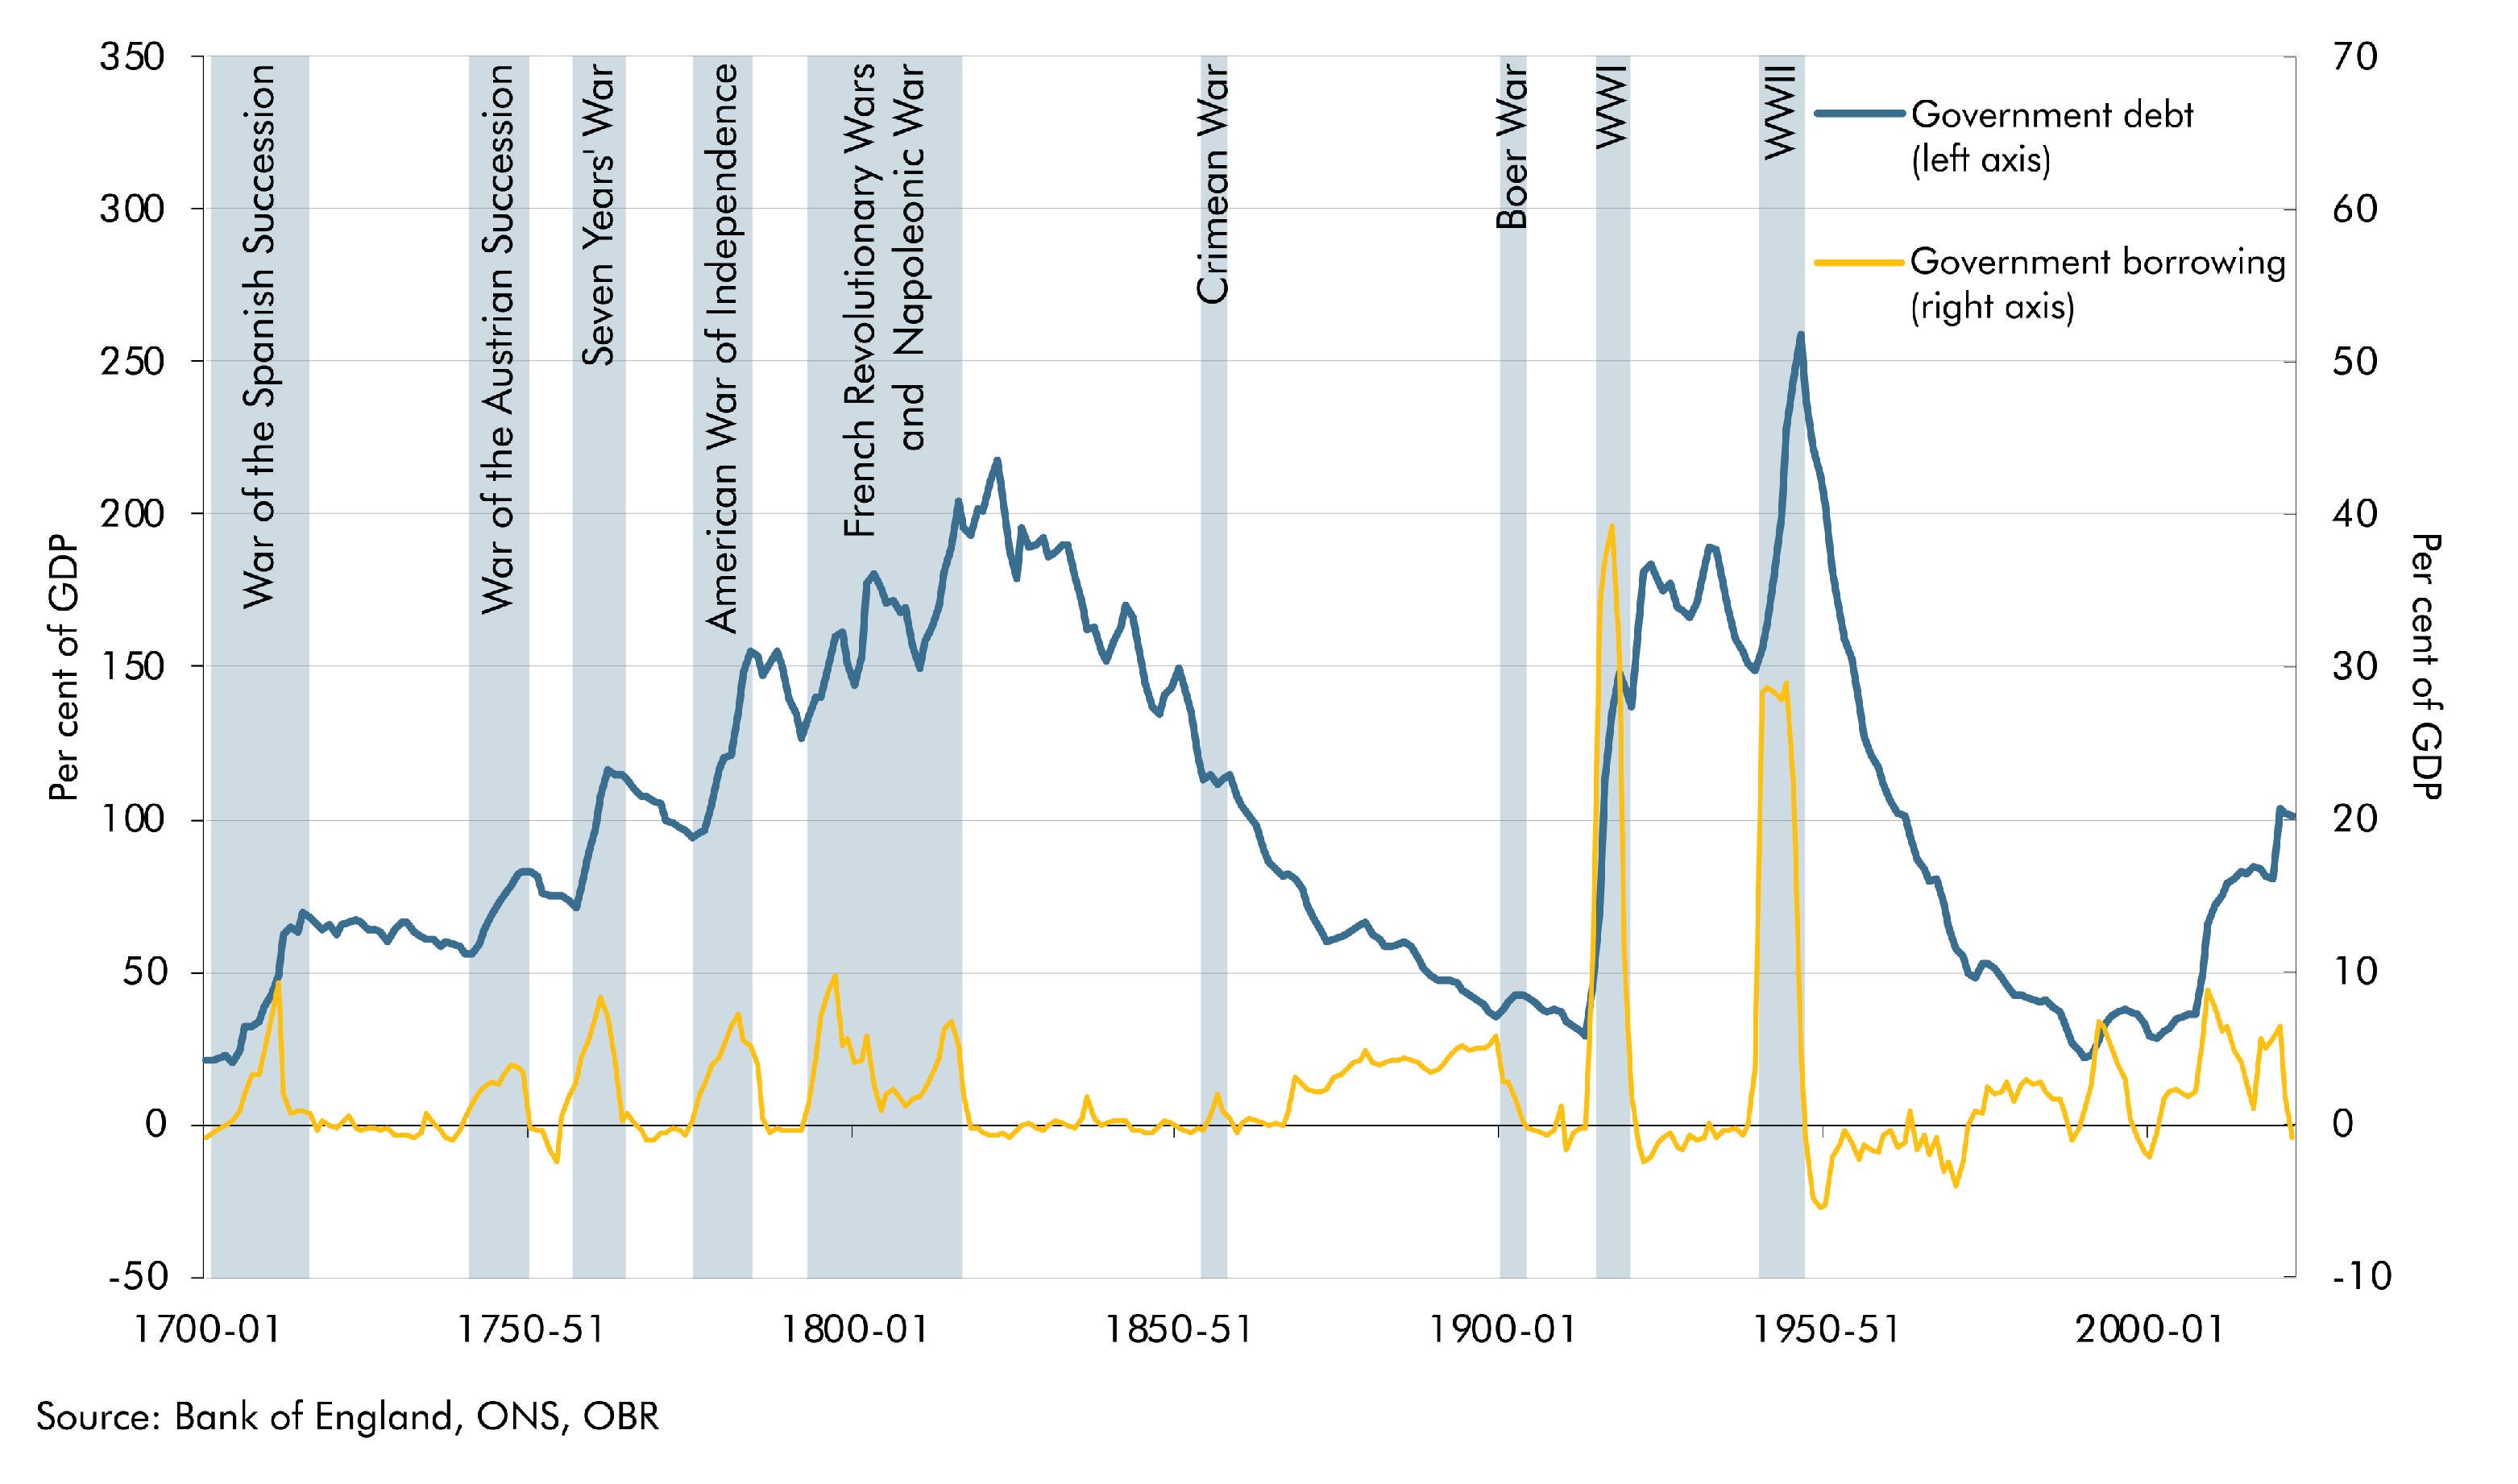
Government borrowing and debt since 1700

How have the public finances of the UK been shaped by the events of the past three centuries? Here’s Conor and Luke to talk you through how tax and public spending have evolved over the past 300 years…
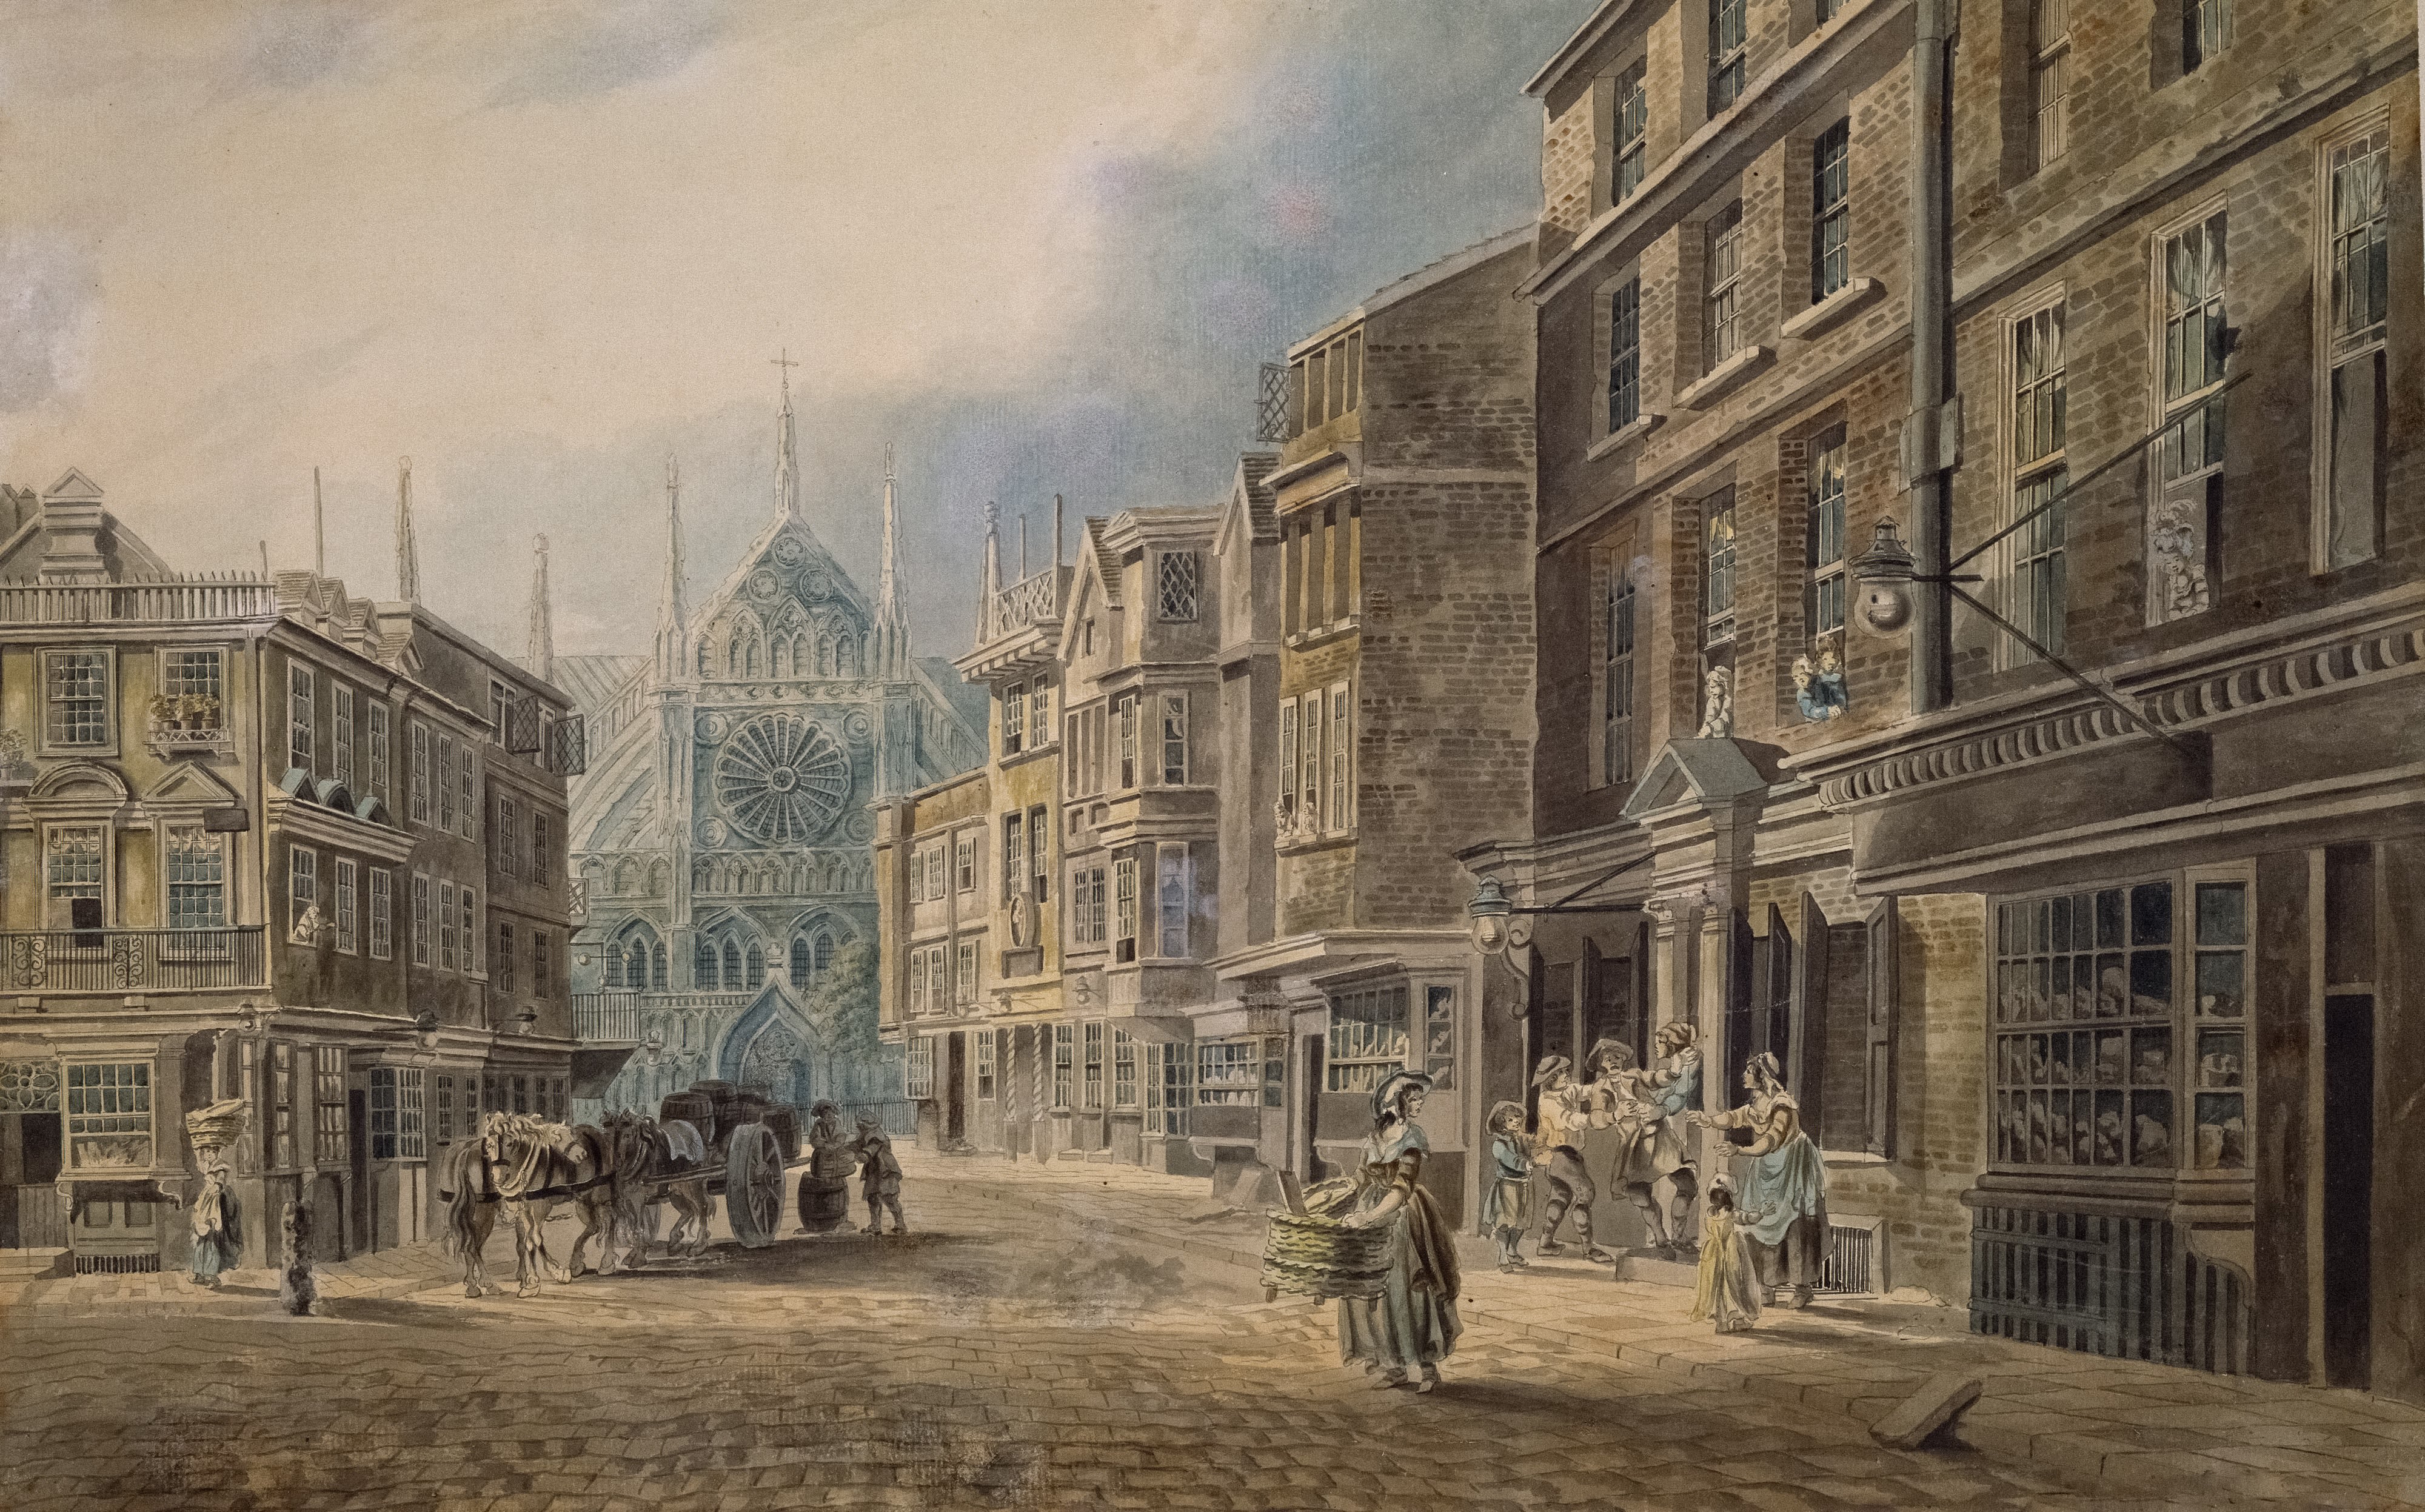
The violent 18th century (1700-1815)

For much of its history, geopolitical tensions and the armed conflicts they generated, have been the driving force behind fiscal outcomes in the UK. The 18th century witnessed a succession of conflicts with the other major European powers and a rising one across the Atlantic. Borrowing was the preferred means of funding wars in this period, and the British Government’s ready access to large pools of financing was a strategic advantage over its rivals. The Bank of England’s establishment in 1694 set the foundations for this borrowing. Before the Bank, the Government and Monarch would borrow from individual goldsmiths at interest rates of up to 30 per cent. The Bank’s involvement greatly increased potential sources of borrowing, lowering the interest rates governments had to pay1.
Over the course of the 18th century, Britain fought five major wars: the War of the Spanish Succession (1701-15); the Seven Years’ War (1756-63); the War of the Austrian Succession (1740-48); the American War of Independence (1775-83); and the French Revolutionary and Napoleonic Wars (1792-1815). Each saw central government borrowing peak at between 5 and 11 per cent of GDP, with governments running balanced budgets during the (relatively rare) peaceful intervals. The result was a steady ratcheting up of the level of debt from 22 per cent of GDP in 1700-01 to 155 per cent on the eve of the Napoleonic Wars.
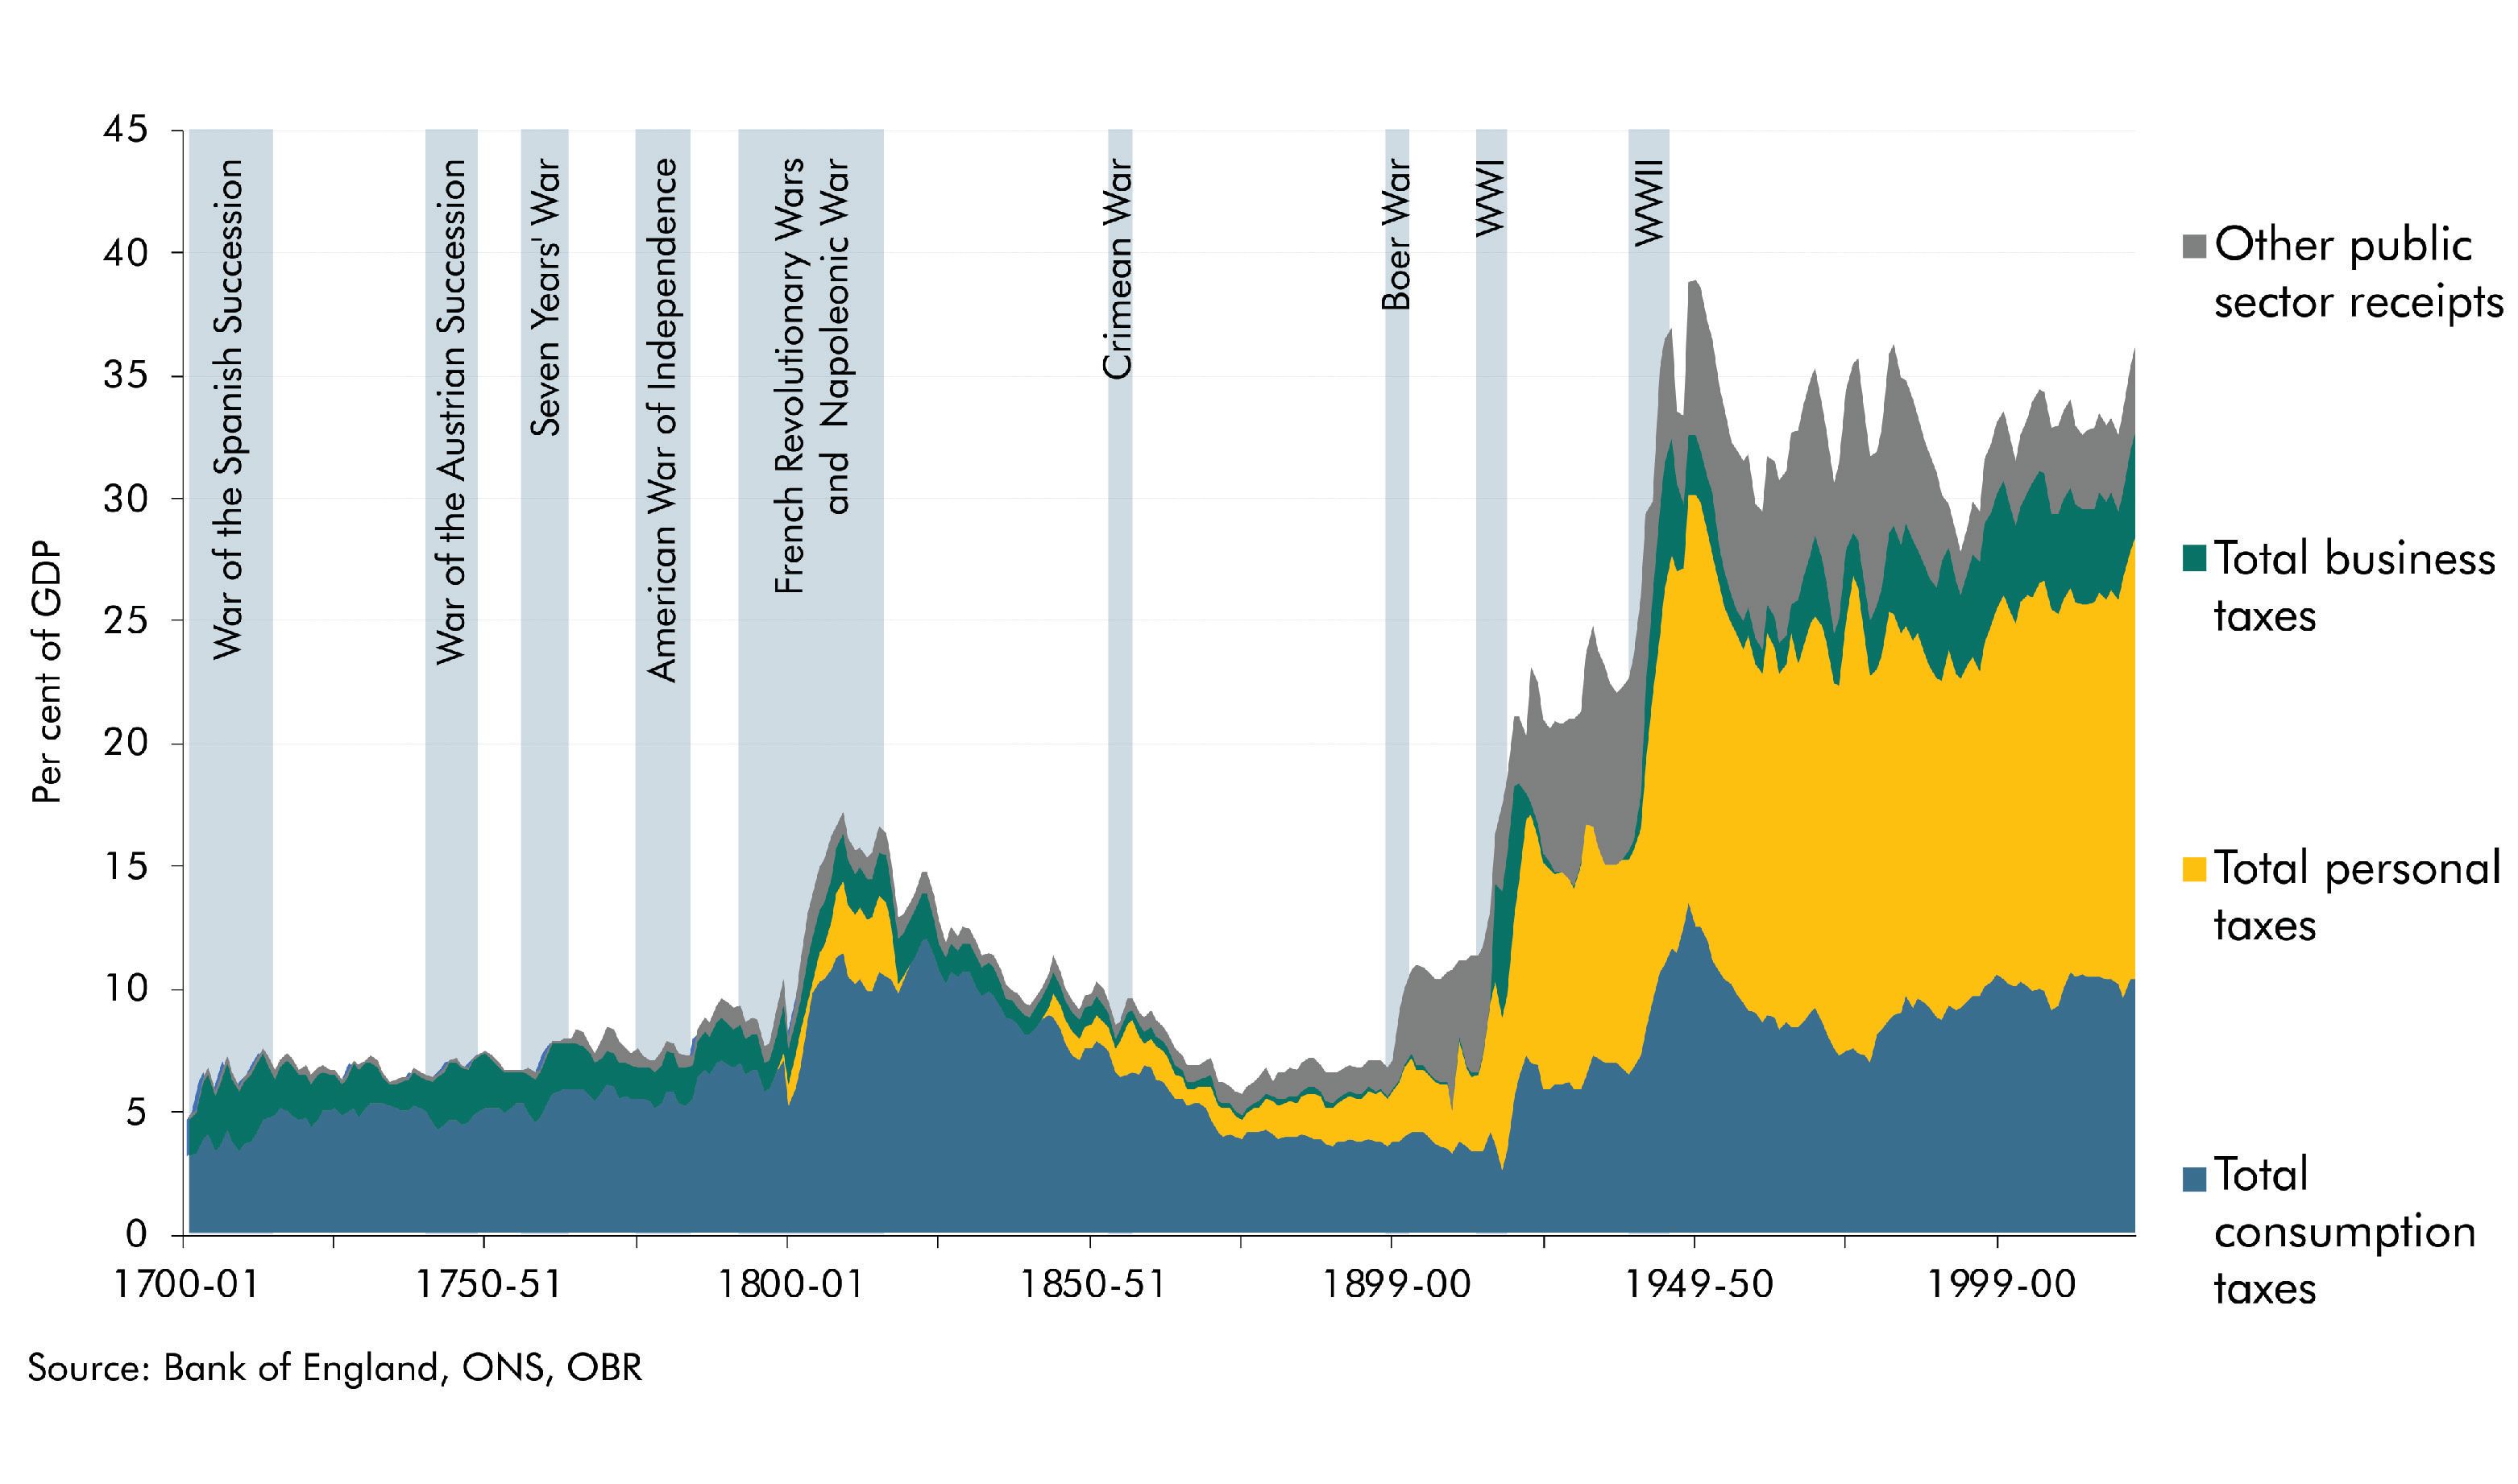
Tax receipts remained broadly flat during the 18th century, averaging 8 per cent of GDP, and kept at a fraction of the tax burden today by the ever-present threat of smuggling. Tax administration in the 18th century was much more challenging than today so there was a greater focus on consumption taxes such as customs and excise duties which could be easily collected at the port, factory, or brewery gate. Famous examples included the window tax and stamp duties on newspapers, whose unintended consequences can still be seen today in dingy Georgian buildings and cumbersome broadsheets.
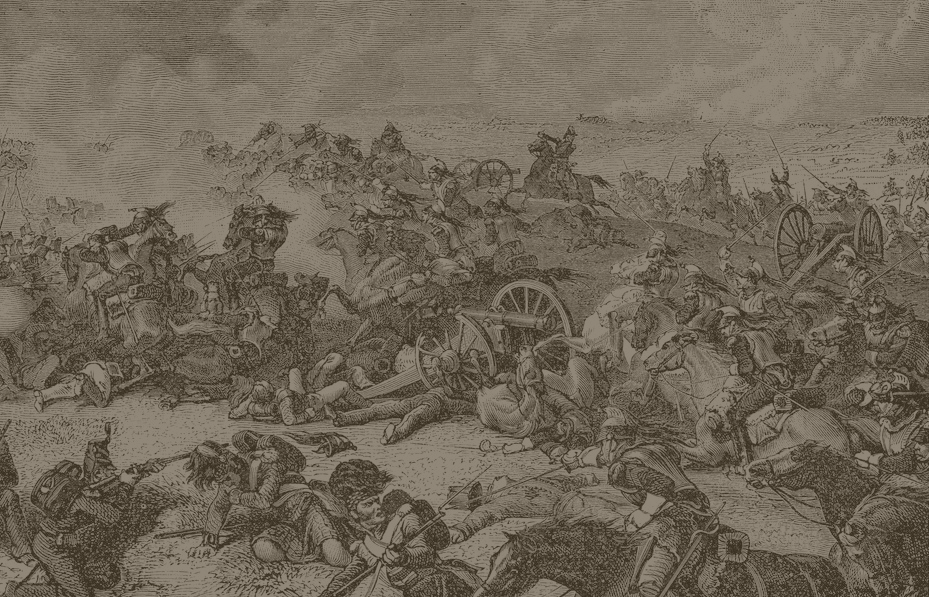
The imperial century (1815-1914)


The succession of major wars over the 18th century finally came to an end at Waterloo in 1815, but left the British Government with a crippling debt burden of close to 180 per cent of GDP. Interest rates on that debt had also risen from 3 to 5 per cent between the beginning and end of the wars, which meant that debt servicing payments were consuming close to two-fifths of annual government revenues. Fortunately, the 19th century would see these fiscal pressures ease as sustained economic growth, coupled with the absence of more major conflicts (as Britain became the dominant global power), enabled debt to steadily fall to a 200-year low of 29 per cent of GDP on the eve of World War I in 1913-14.
To help pay for the cost of the war with France, the first income tax was introduced by William Pitt the Younger in 1799. It was progressive but levied at much lower rates than today’s income tax, so its fiscal impact was modest, raising 1 per cent of GDP. It proved very unpopular, however, and was scrapped in 1816 following the end of the war. While the rest of the 19th century saw the burden of taxation fall from 12 to 7 per cent, it also saw its incidence shift from consumption to income. Customs and excise duties constituted 70 per cent of total receipts in 1820-21, a figure that had fallen to below 50 per cent by the end of the 19th century. The main shift occurred in the mid-19th century, when growing opposition to tariffs led the then-prime minister, Sir Robert Peel, to remove duties on more than 700 goods (including the repeal of the Corn Laws). To compensate for the loss of revenues from trade, income tax was reintroduced in 1842. Though initially temporary, it was made permanent following Britain’s engagement in the Crimean War.
Government receipts since 1700
The World Wars (1914-1945)


Prior to the onset of WWI, debt had fallen to 29 per cent of GDP, the budget was in balance, and government spending and receipts were both around 13 per cent of GDP. The two World Wars completely changed Britain’s fiscal complexion.
During WWI, spending leapt from 8 per cent of GDP in 1913-14 to 62 per cent in 1917-18, of which almost all was defence spending. This was partly funded through a dramatic increase in tax revenue, which rose from 13 to 20 per cent of GDP in 1917-18, with the number of people paying income tax tripling during this period before falling away in the early 1920s. The Government also borrowed to fund the war, running average deficits of 24 per cent of GDP during the war and driving debt to 143 per cent GDP in 1918-19.
Spending on defence fell back after WWI – from 52 per cent of GDP in 1917-18 to 8 per cent two years later. The debt-to-GDP ratio remained high during the interwar years, in part due to the depression, and debt interest payments averaged 25 per cent of receipts.
When World War II began in 1939, Britain’s stock of debt stood at 135 per cent of GDP. Spending as a share of GDP rose to its WWI peak of 62 per cent in 1944-45, of which 80 per cent was defence spending. Tax revenues as a share of GDP rose to 39 per cent. But the bulk of this second ‘total war’ was also funded from borrowing which peaked at 27 per cent of GDP in 1941-42. At the end of WWII, Britain’s debt stood at 249 per cent of GDP, an all-time high.
From warfare to welfare state (1945-2023)


The post-war years saw a radical expansion and reshaping of the British state with lasting fiscal repercussions. The two World Wars left a huge financial burden: a debt-to-GDP ratio of close to 250 per cent and borrowing at 6 per cent of GDP in 1946-47. The debt-to-GDP ratio fell steadily in the decades following the war to reach 24 per cent in 1991-92, before rising to 100 per cent in 2022-23 following the shocks of the financial crisis, pandemic, and energy crisis.
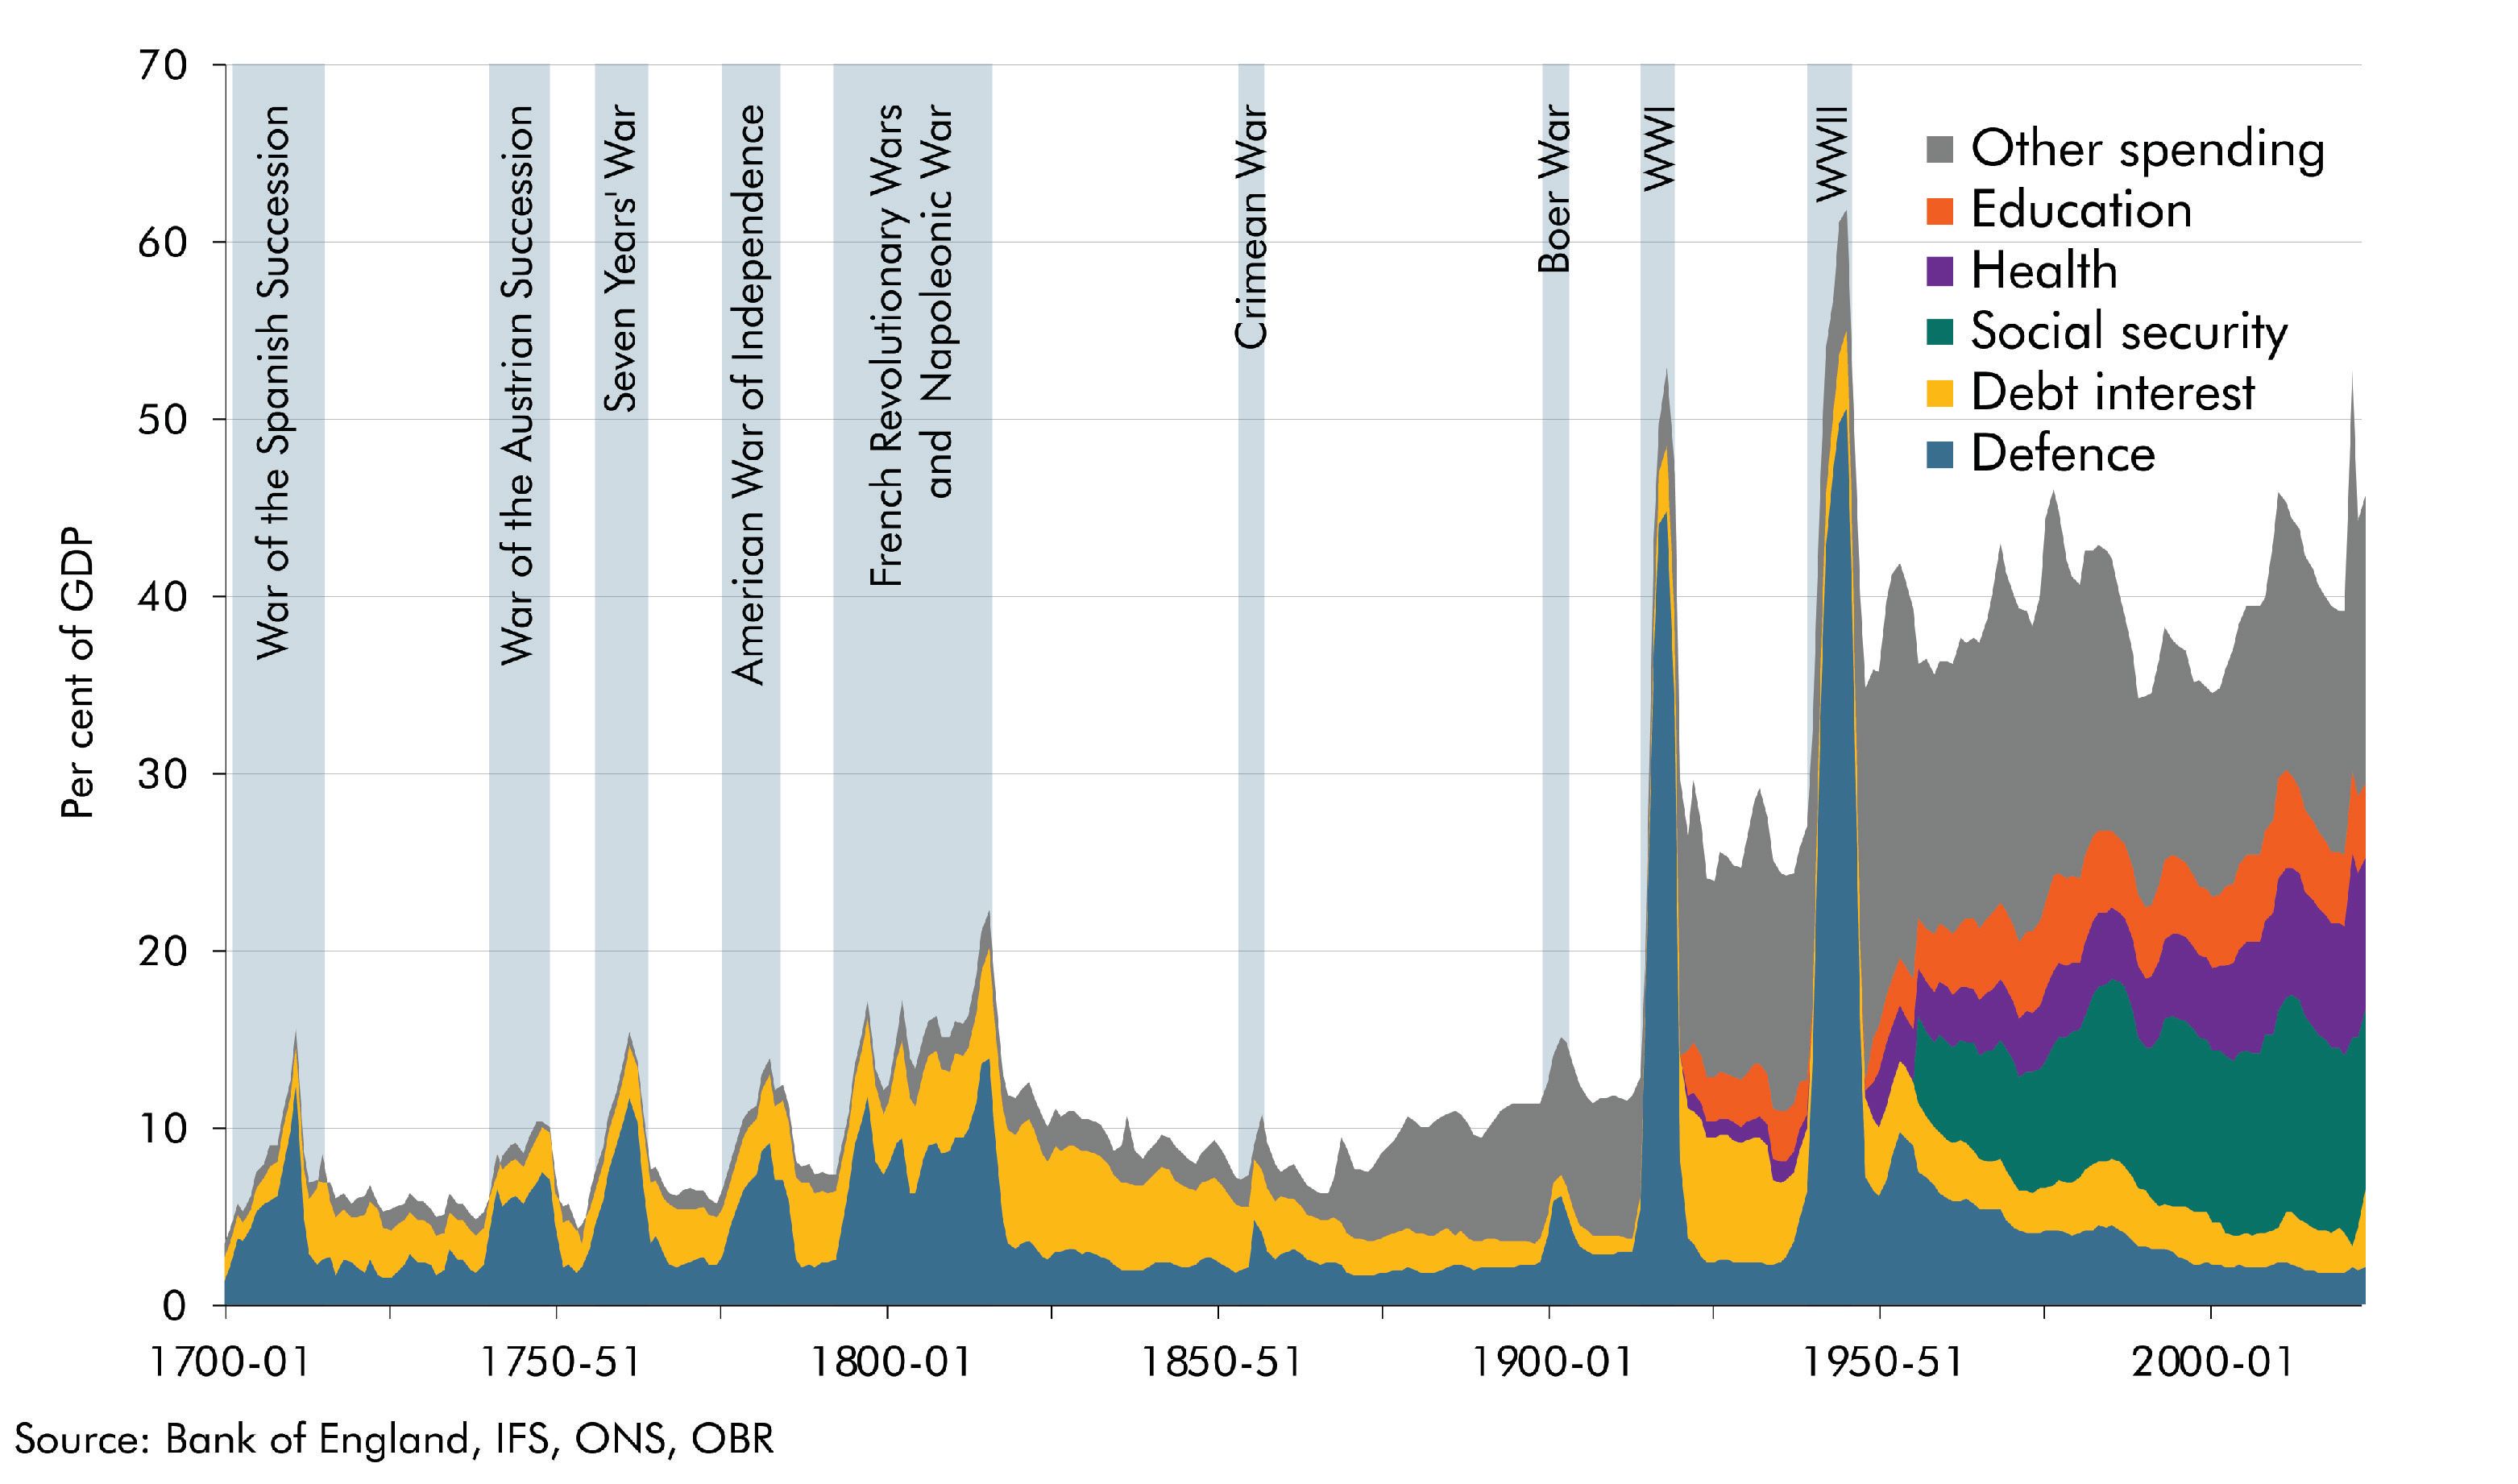
Spending rose from 27 per cent of GDP in the ten years before the war, to 42 per cent of GDP in the decade after 1945, and rose still further to 46 per cent in 2022-23. The composition also changed significantly:
- Defence spending declined from 50 per cent of GDP in 1944-45 to 5 per cent in the 1960s to 2 per cent in 2022-23, creating a ‘peace dividend’.
- This made space for the creation and expansion of the welfare state: health spending rose from 3 per cent of GDP in 1955-56 to 9 per cent in 2022-23, social security from 5 to 10 per cent and education from 3 to 4 per cent.
- Debt interest payments as a share of GDP fell for much of the post-war period, due to falling debt in the two decades after WWII and declining government borrowing costs since the 1980s. However, this has changed in the past couple of years with interest payments rising sharply to 5 per cent of GDP in 2022-23 from a low of 2 per cent in 2002-03.
Government spending since 1700
Following WWII, the tax-to-GDP ratio fell to a low of 28 per cent of GDP in 1960-61 before increasing to close to its immediate post-war level in the 1970s. The 1980s saw the tax burden fall again as a result of cuts to income tax and a fall in oil and gas revenues. Since the 1990s, the tax burden has risen and now stands at a 70-year high of 36 per cent of GDP. The 20th century also saw a number of key changes to the tax system:
- The introduction of PAYE in 1944, meant governments could collect more income and other personal taxes.
- National Insurance contributions were expanded in 1948 to help pay for the new National Health Service and State Pension.
- VAT was introduced in 1973, to replace the Sales Purchase Tax, and has steadily risen from 2 per cent of GDP to 7 per cent in 2022-23.
- New taxes such as petroleum revenue tax and capital gains tax targeted parts of the economy that had not been taxed before.
Looking ahead


As witnessed by this new historical dataset, the public finances are a reflection of the prevailing challenges of the age and changing role of government in responding to them. Looking over the next 50 years, our latest long-term fiscal projections suggest that dealing with an ageing population, climate change, weak productivity growth, high public debt, rising interest rates, and growing geopolitical tensions will further reshape the public finances in the years ahead.
Acknowledgements
We are grateful for the engagement, expertise, and insights from various OBR staff members in compiling this article.
Downloads
300 years of UK public finance data (article PDF)
Historical public finances database (excel)