

Forecasting participation trends: the cohort model


In this article we provide an explanation of our forecasting process for the trend participation rate. We discuss how we use a cohort model, which combines Labour Force Survey data and ONS population projections, to inform this forecast. We also explain how we make adjustments for future changes in the state pension age and incorporate other judgements.
Overview


Trends in labour supply (the total number of hours worked in the economy) are a key driver of long-term potential output. To forecast total labour supply, we combine projections for the adult population, the share of this population participating in the labour market, the equilibrium rate of unemployment, and average hours worked.
In this article, we focus on how we estimate the share of the population that participates in the labour market. The importance of labour market participation is highlighted by a series of government policy measures in recent years aimed at increasing participation and addressing the sharp rise in health-related inactivity since the pandemic. But even before we consider the effects of these recent shocks and the policy measures aiming to address them, we have to understand and project the impact of underlying demographic changes, migration flows, and retirement age decisions on the future path of participation.
Our forecast for participation, like all other parts of our forecast, is ultimately subject to the judgement of the Budget Responsibility Committee (BRC). This judgement is informed by a range of analysis and model outputs produced by OBR staff.
One of the key inputs to inform our participation forecast is a cohort-based model of the evolution of population and the participation rates of different age cohorts. The model projects the participation of people born in the same year as they age, using historical data as a guide. This gives us an idea of how the potential participation rate could evolve over time, excluding the effects of spare capacity or excess demand in the labour market. The model uses two main sources of data:
- The Office for National Statistics (ONS) population projections, which the model uses for forward-looking calculations. These projections incorporate assumptions about births, deaths, and net migration. This ensures that we properly account for demographic changes in our participation forecasts, allowing for changes in cohort size and composition over time.
- The Labour Force Survey (LFS), which provides historical annual participation rates by age. The model uses these inputs to calculate the probability that those of a given age will enter or exit the labour market.
This article discusses how the model combines the ONS population projections with historical labour market data from the LFS to calculate the participation rate for each cohort using entry and exit rates. It also discusses how these rates are adjusted for future changes in the state pension age (SPA), and how we use that information to inform the forecast.
Entry and exit rates


The cohort model takes the ONS population projections and produces a forecast for the participation rate of each cohort as it ages. The participation rates in the model come from the assumed labour market entry and exit rates for people of different ages, estimated using an average of the historical LFS data. We assume these entry and exit rates remain constant at each age over the forecast period, apart from adjustments for changes to the SPA. If we think these rates will be different in future, we might then adjust them further, for example due to observed changes in childcare or health trends.
If the average participation rate rises between one age group and the next, we calculate an entry rate as the change in participation divided by the share of people not currently participating. Similarly, if the average participation rate falls between one age group and the next, the exit rate is the drop in participation relative to the current level of participation.
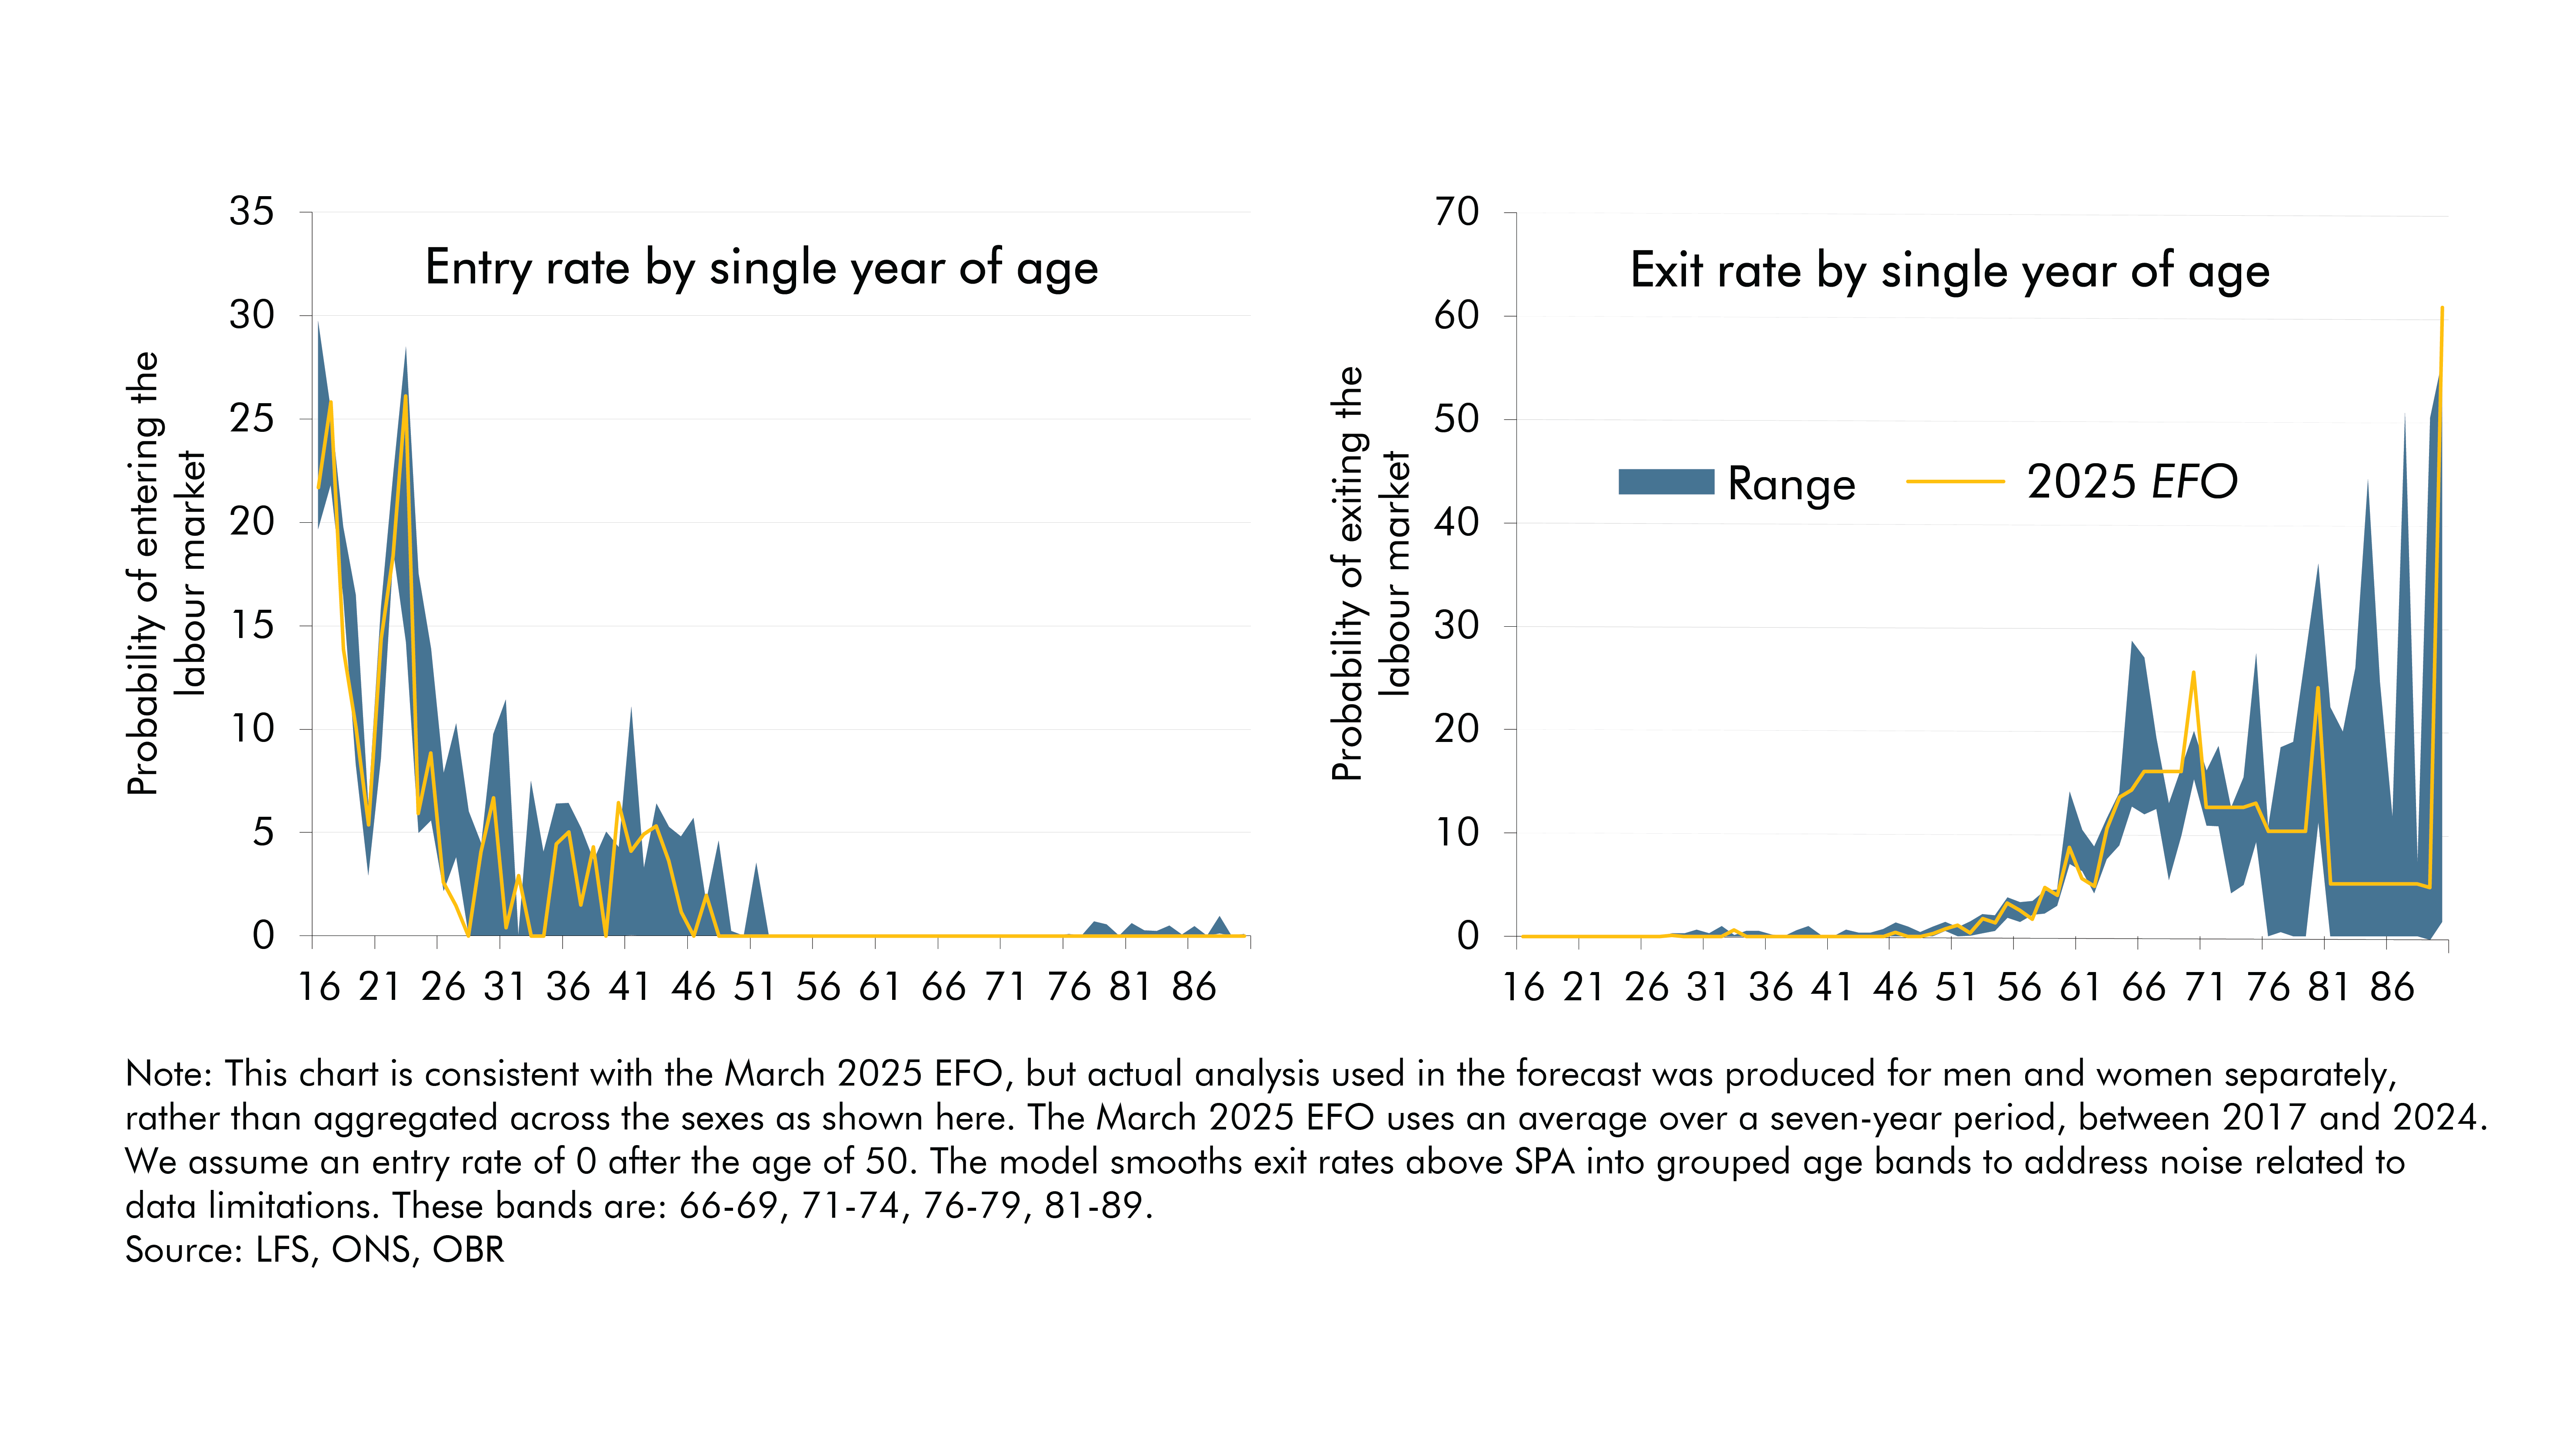
Chart 1 shows the entry and exit rates we used in the March 2025 Economic and fiscal outlook (EFO), with a range showing the highest and lowest five-year rolling averages between 2008 and 2024. The left panel shows entry rates with prominent peaks at ages 16 and 22, corresponding to the entry of younger people into the workforce after secondary and tertiary education. Entry rates then dip around age 30, likely due to childcare responsibilities, before rising around age 40 as parents return to work. In contrast, exit rates steadily increase with age, spiking sharply around the state pension age. Further step changes and spikes after 66 are largely due to the model grouping exit rates at older ages to smooth out the smaller sample sizes in the data.
Chart 1: Labour force entry and exit rates by single year of age

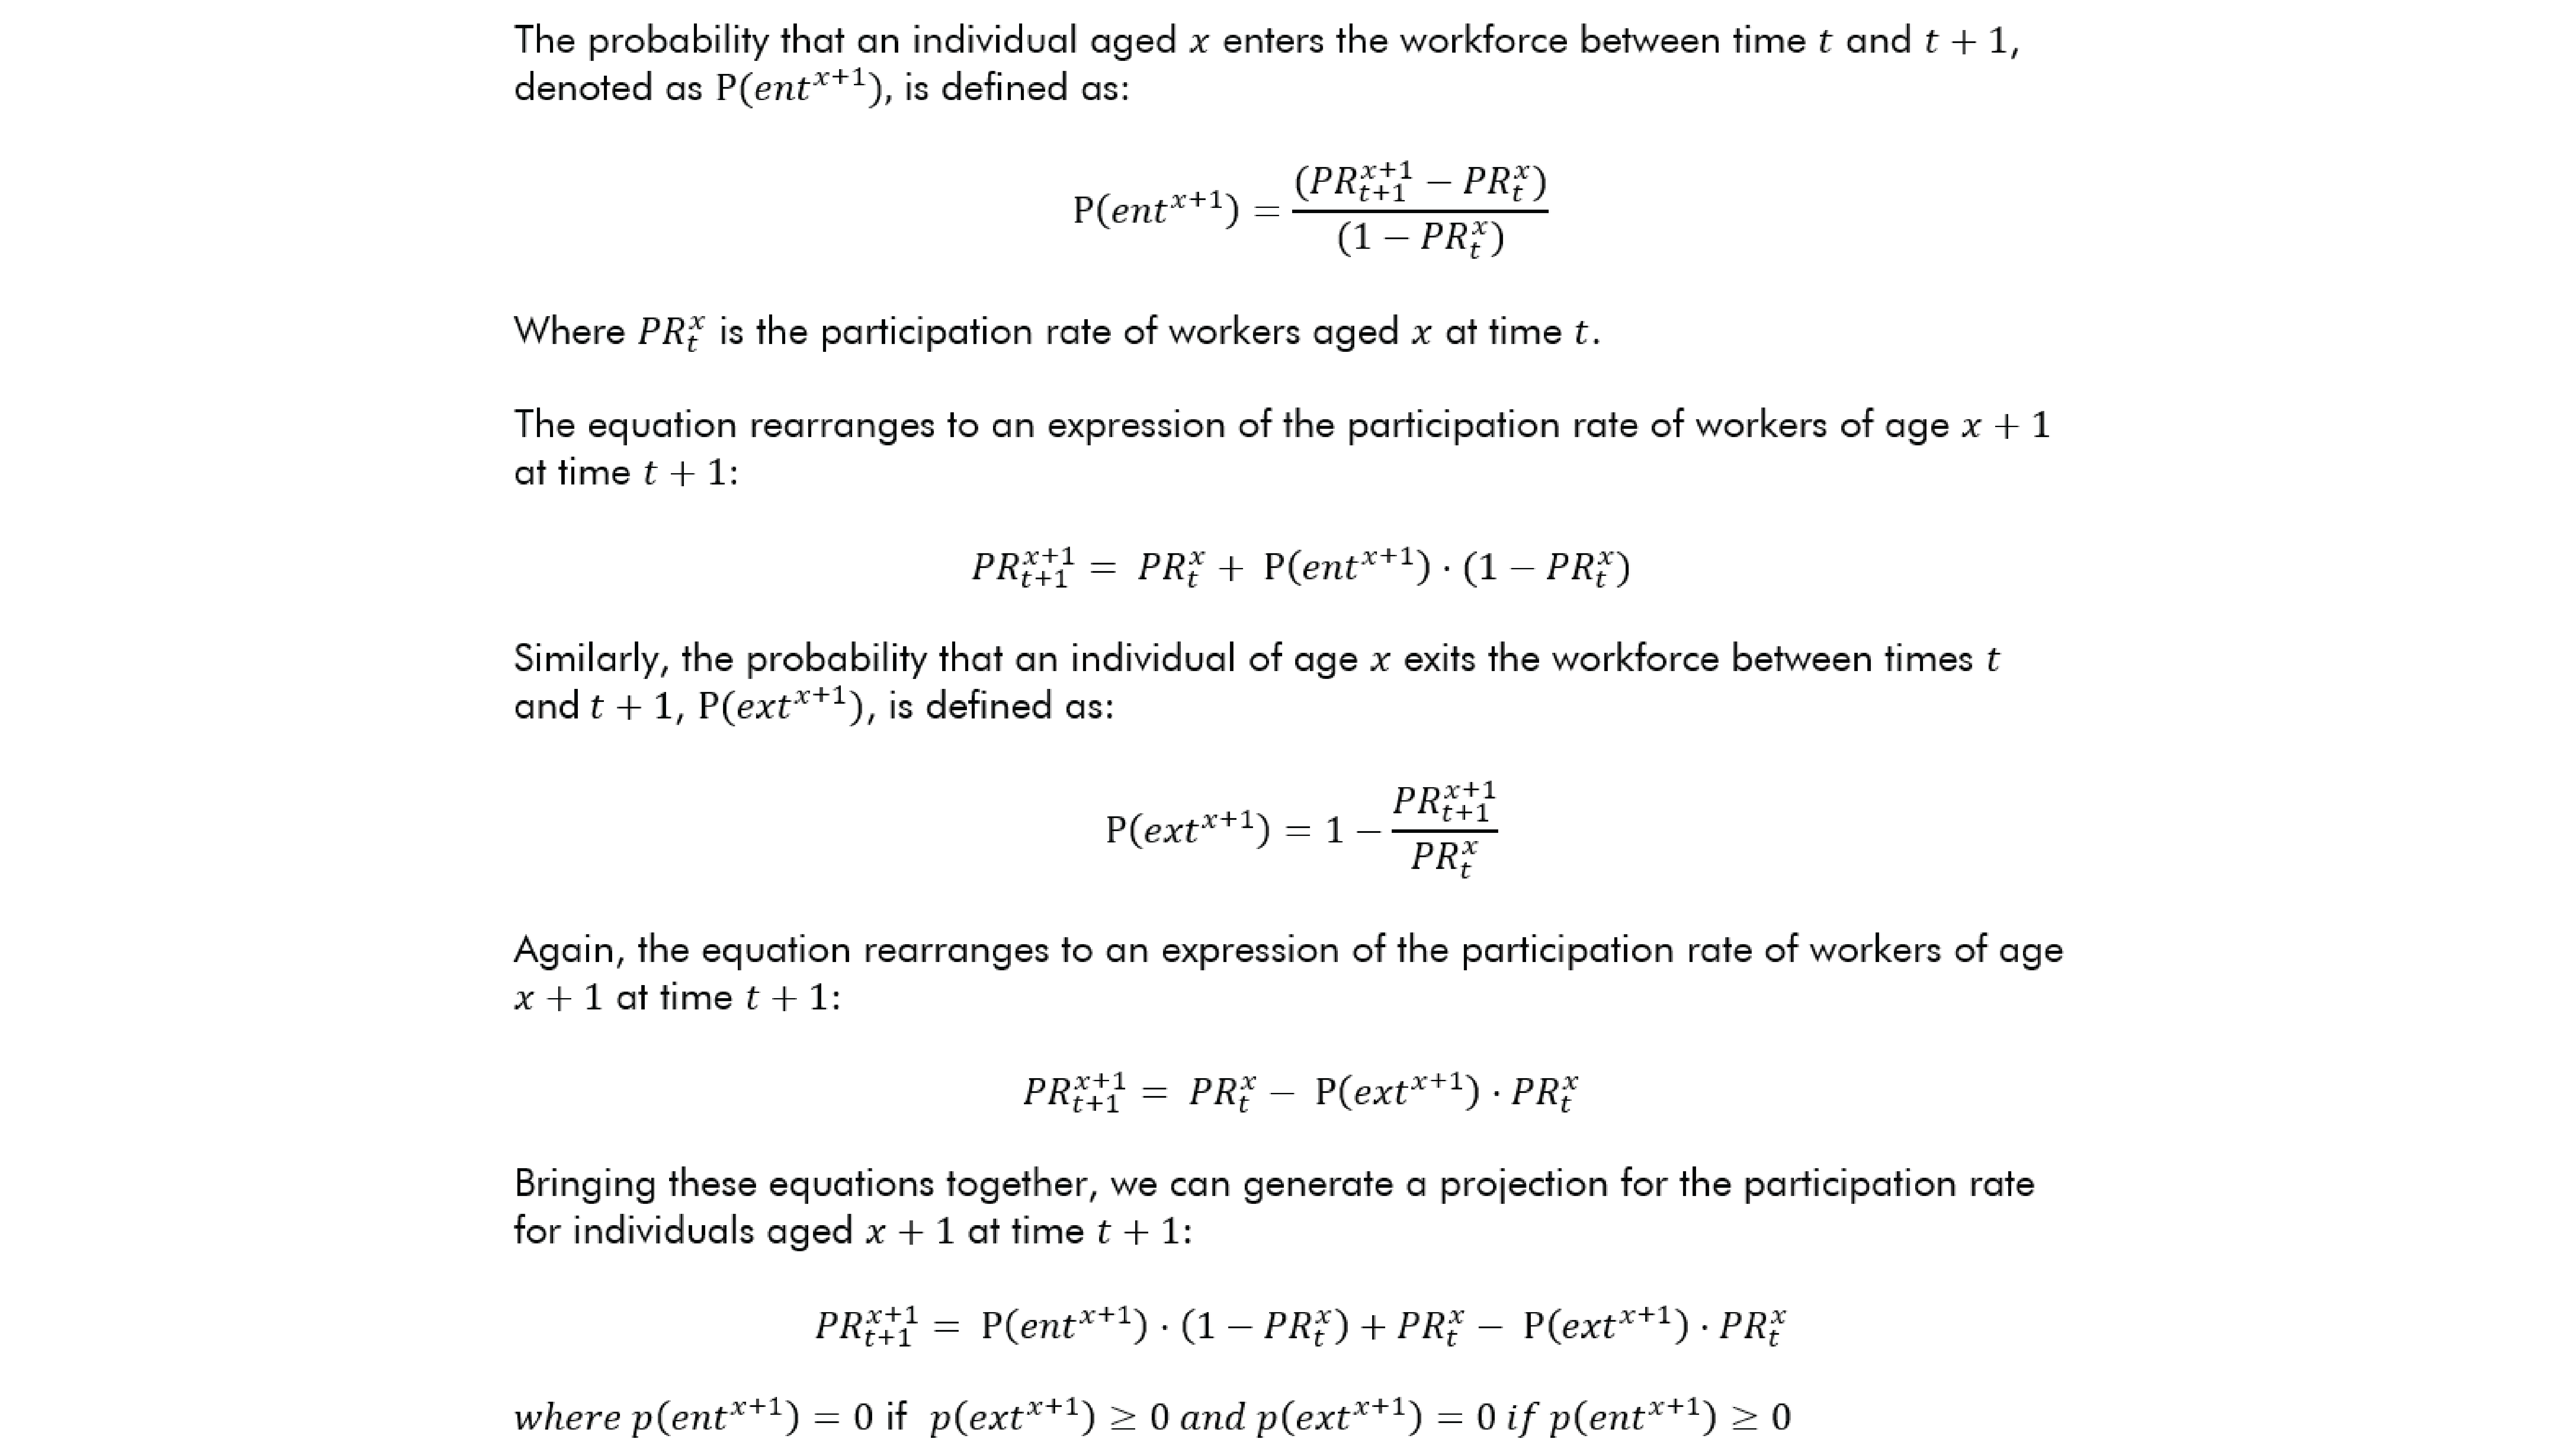
The model then uses these entry and exit rates to generate the projected participation rate for each age in each future year. This allows for the estimation of future participation by ‘rolling forward’ each cohort, accounting for the flow of people into and out of the labour force over time.1 For example, the participation rate of 30-year-olds in 2025 equals the participation rate of 29-year-olds in 2024 plus the product of the entry rate of 30-year-olds and the inactivity rate of 29-year-olds.
For forecasting purposes, we run the model separately for men and women, to capture different historical trends in participation rates. We use these results, in combination with the ONS population projections, to estimate the level of participation for each single year of age. The results are then aggregated to the whole economy to produce an estimate of the potential participation rate.
State pension age changes


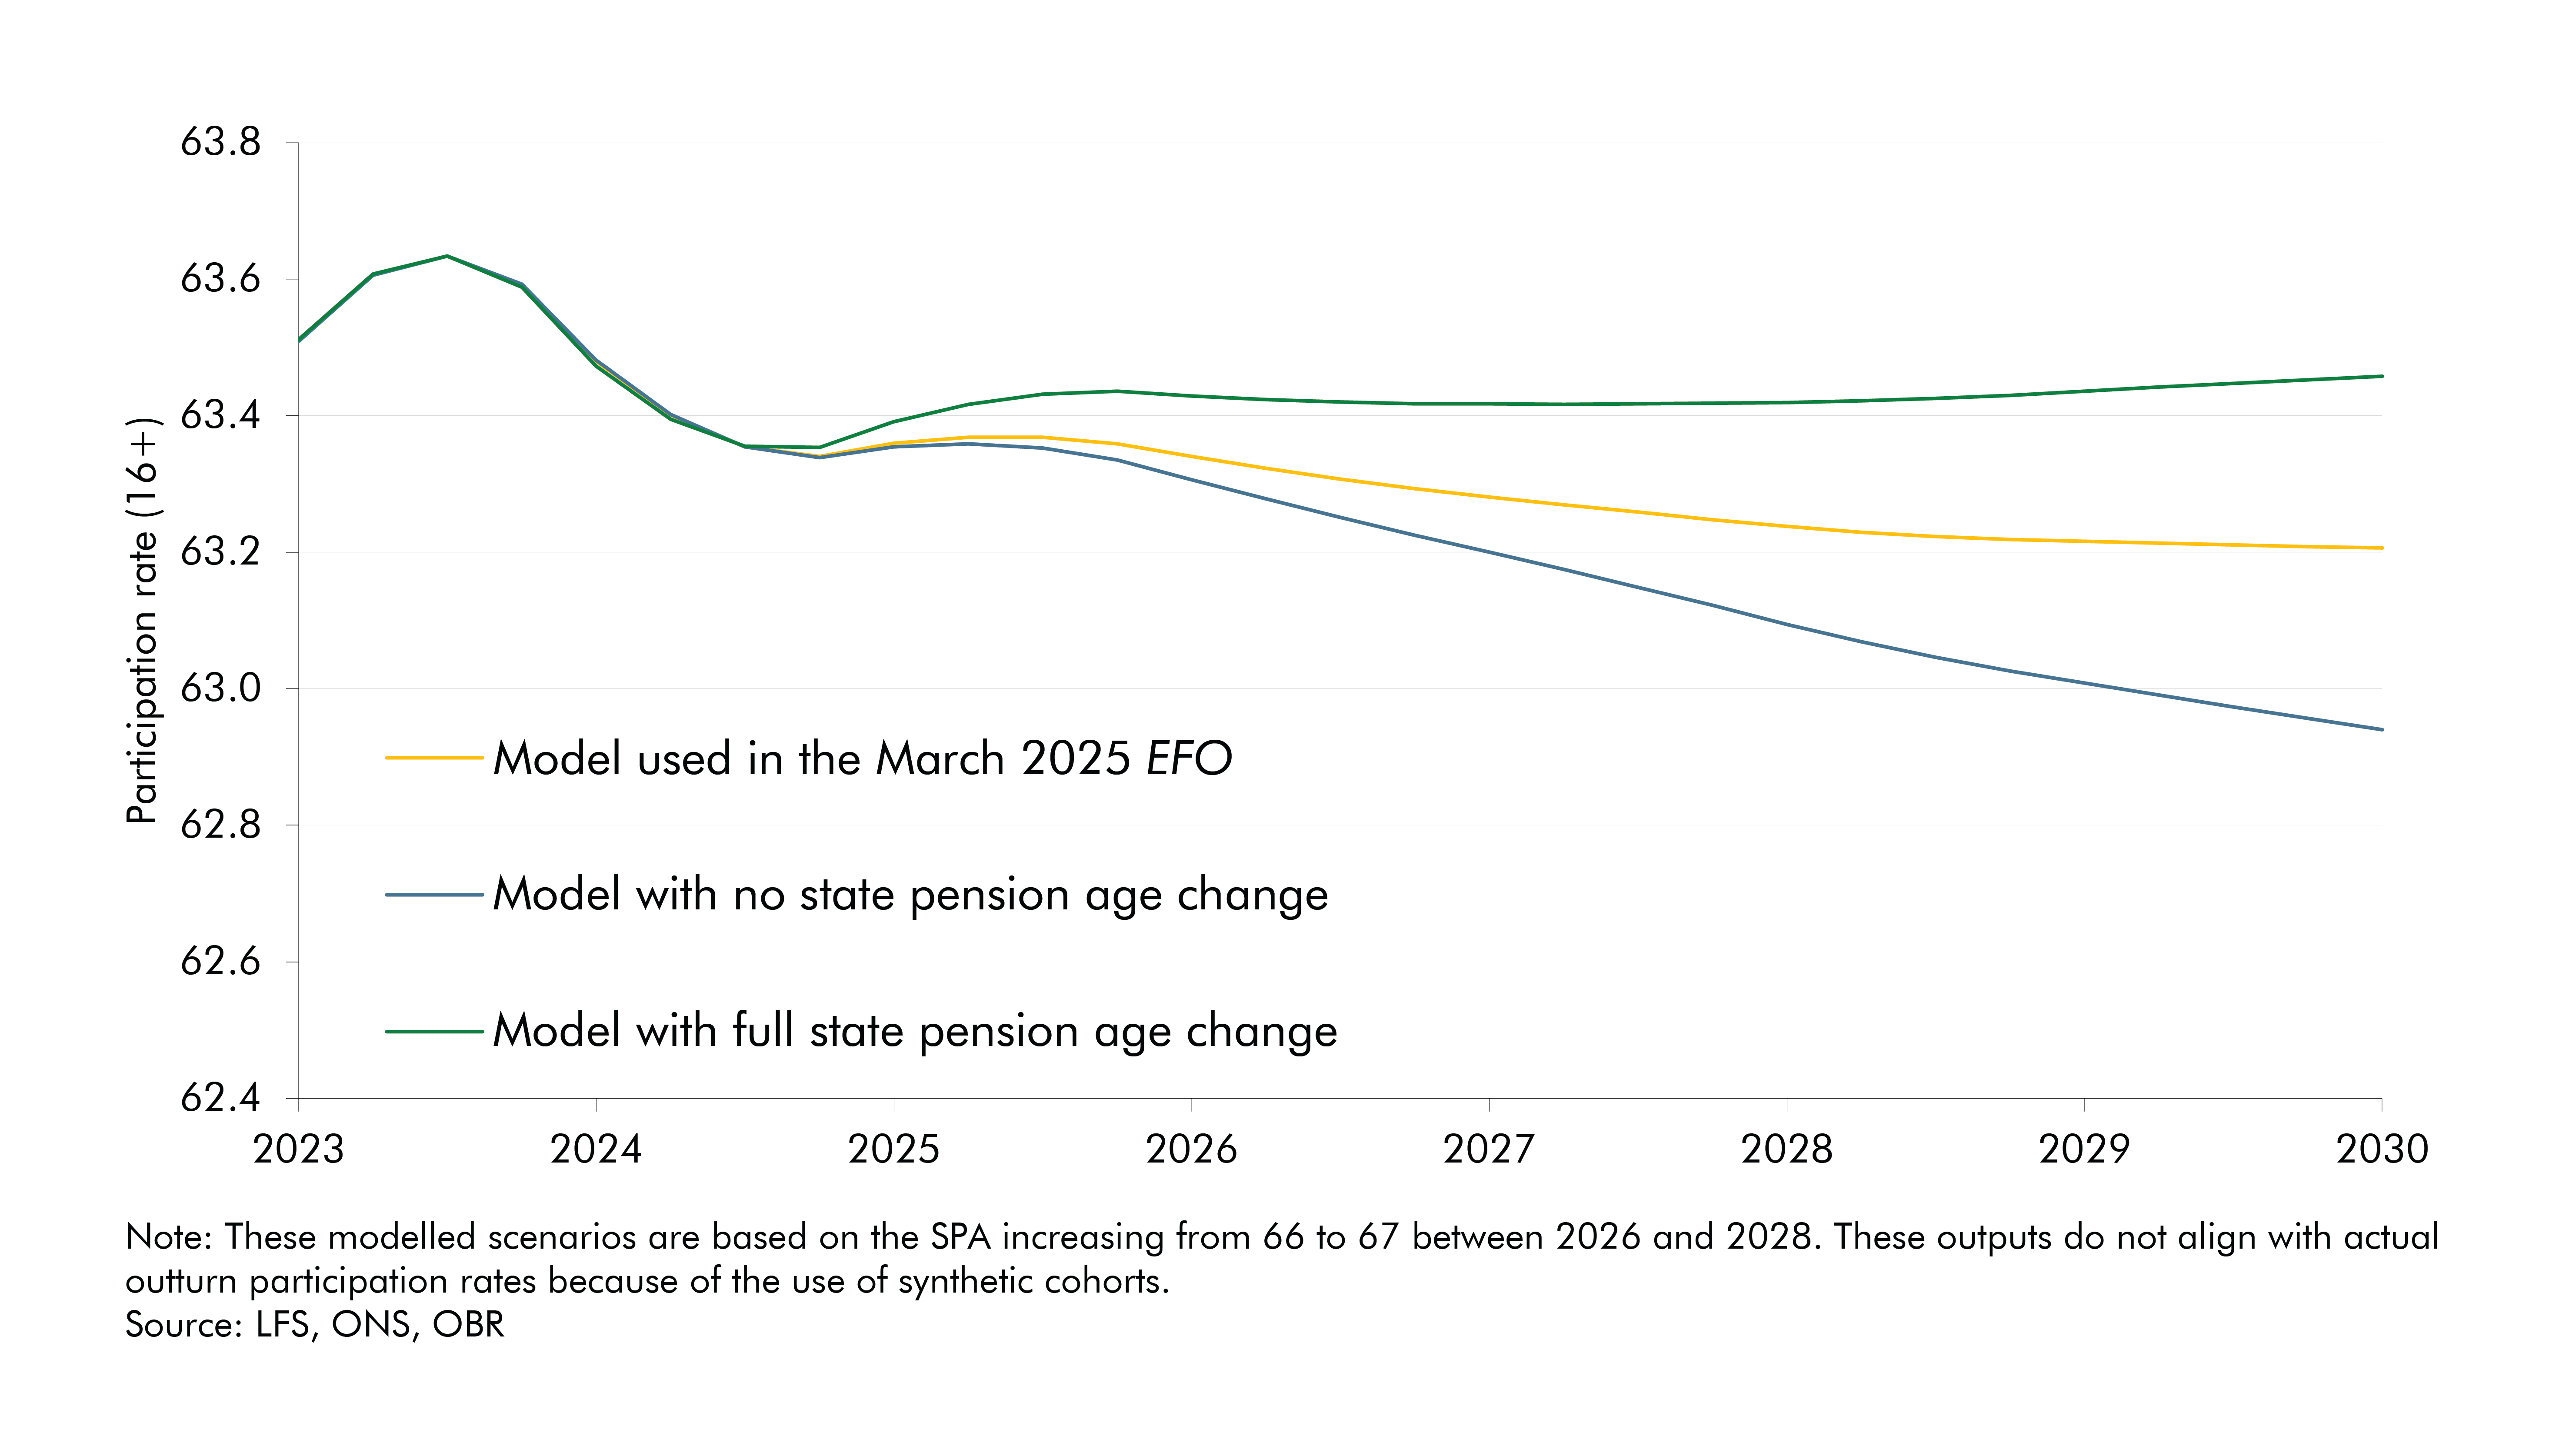
Changes to the state pension age (SPA) feed into the cohort model through adjustments to exit rates for those aged 55 and above, as retirement decisions become more relevant. Like all other age groups, entry and exit rates are based on historical labour market behaviour. However, when the government introduces a change to the SPA, we expect workforce exit timings to shift relative to historical behaviour. Chart 2 illustrates the impact of changes to the state pension age on the overall potential participation rate produced by the cohort model (green line), and then the adjustments we made to these results to produce our final forecast in March (yellow line).
The model results incorporating SPA changes (the green line in Chart 2) assume that older workers respond perfectly to the information of a SPA change. For example, when the retirement age rises from 66 to 67 between 2026 and 2028, the model shifts historical exit rates later by a year. This reflects the fact that people are likely to remain in the labour market for longer. These shifted rates are applied as a gradual adjustment, rather than an abrupt change. Each cohort’s likelihood of adopting the new exit rate depends on two factors: how far it is from retirement age; and how far it is from the year the SPA change takes effect. The further a cohort is from both retirement and implementation, the more weight is given to the new, delayed retirement behaviour. Conversely, those closer to retirement or the policy change are more likely to follow the old patterns.2 This approach increases the participation rate by 0.5 percentage points by the end of the forecast period relative to a scenario in which older workers do not change their participation rate at all following an SPA change (illustrated by the blue line in Chart 2).
To produce our central forecast estimate (the yellow line in Chart 2), we apply a judgement to these modelled results based on how likely it is that those at or approaching the state pension age will move to the new participation rate. We do this by looking at the implied change in participation rates for individual age groups from the model, compare these with those from previous SPA changes, and then consider how we think behavioural changes will differ from the previous increases (if at all). In the March 2025 EFO, this assumption increases the participation rate by 0.3 percentage points at the end of the forecast period relative to the scenario in which there is no change in the participation rate, around three-fifths of the rise implied by the unadjusted model results.
Chart 2: 16+ participation rate under different model scenarios
Limitations


The model provides a useful framework for projecting future participation trends, but it is important to recognise its limitations. In the later years of the forecast period which are further removed from the outturn data upon which the model is based, the assumption that cohort behaviours hold constant becomes less plausible. It can also underestimate the impact of broader economic and social factors such as health, education, and work preferences on participation trends in the near term due to the historical averaging of LFS data.
As a result, we undertake top-down sense checks of aggregated age groups based on the social and economic factors that we would expect to drive participation over the forecast. We then adjust the entry and exit rates from our historical averaging approach if we think that future behaviour will be different to the past. We also complement this cohort-based approach to forecasting participation with other analysis, such as looking trends in inactivity by reason and comparable data on welfare caseloads.
Producing a forecast


Producing a forecast involves several steps to ensure the outputs of the cohort model reflect the judgement of the BRC. We use the slope from the cohort model, apply it to outturn data to produce an initial path for the potential participation rate, then layer on additional judgements.
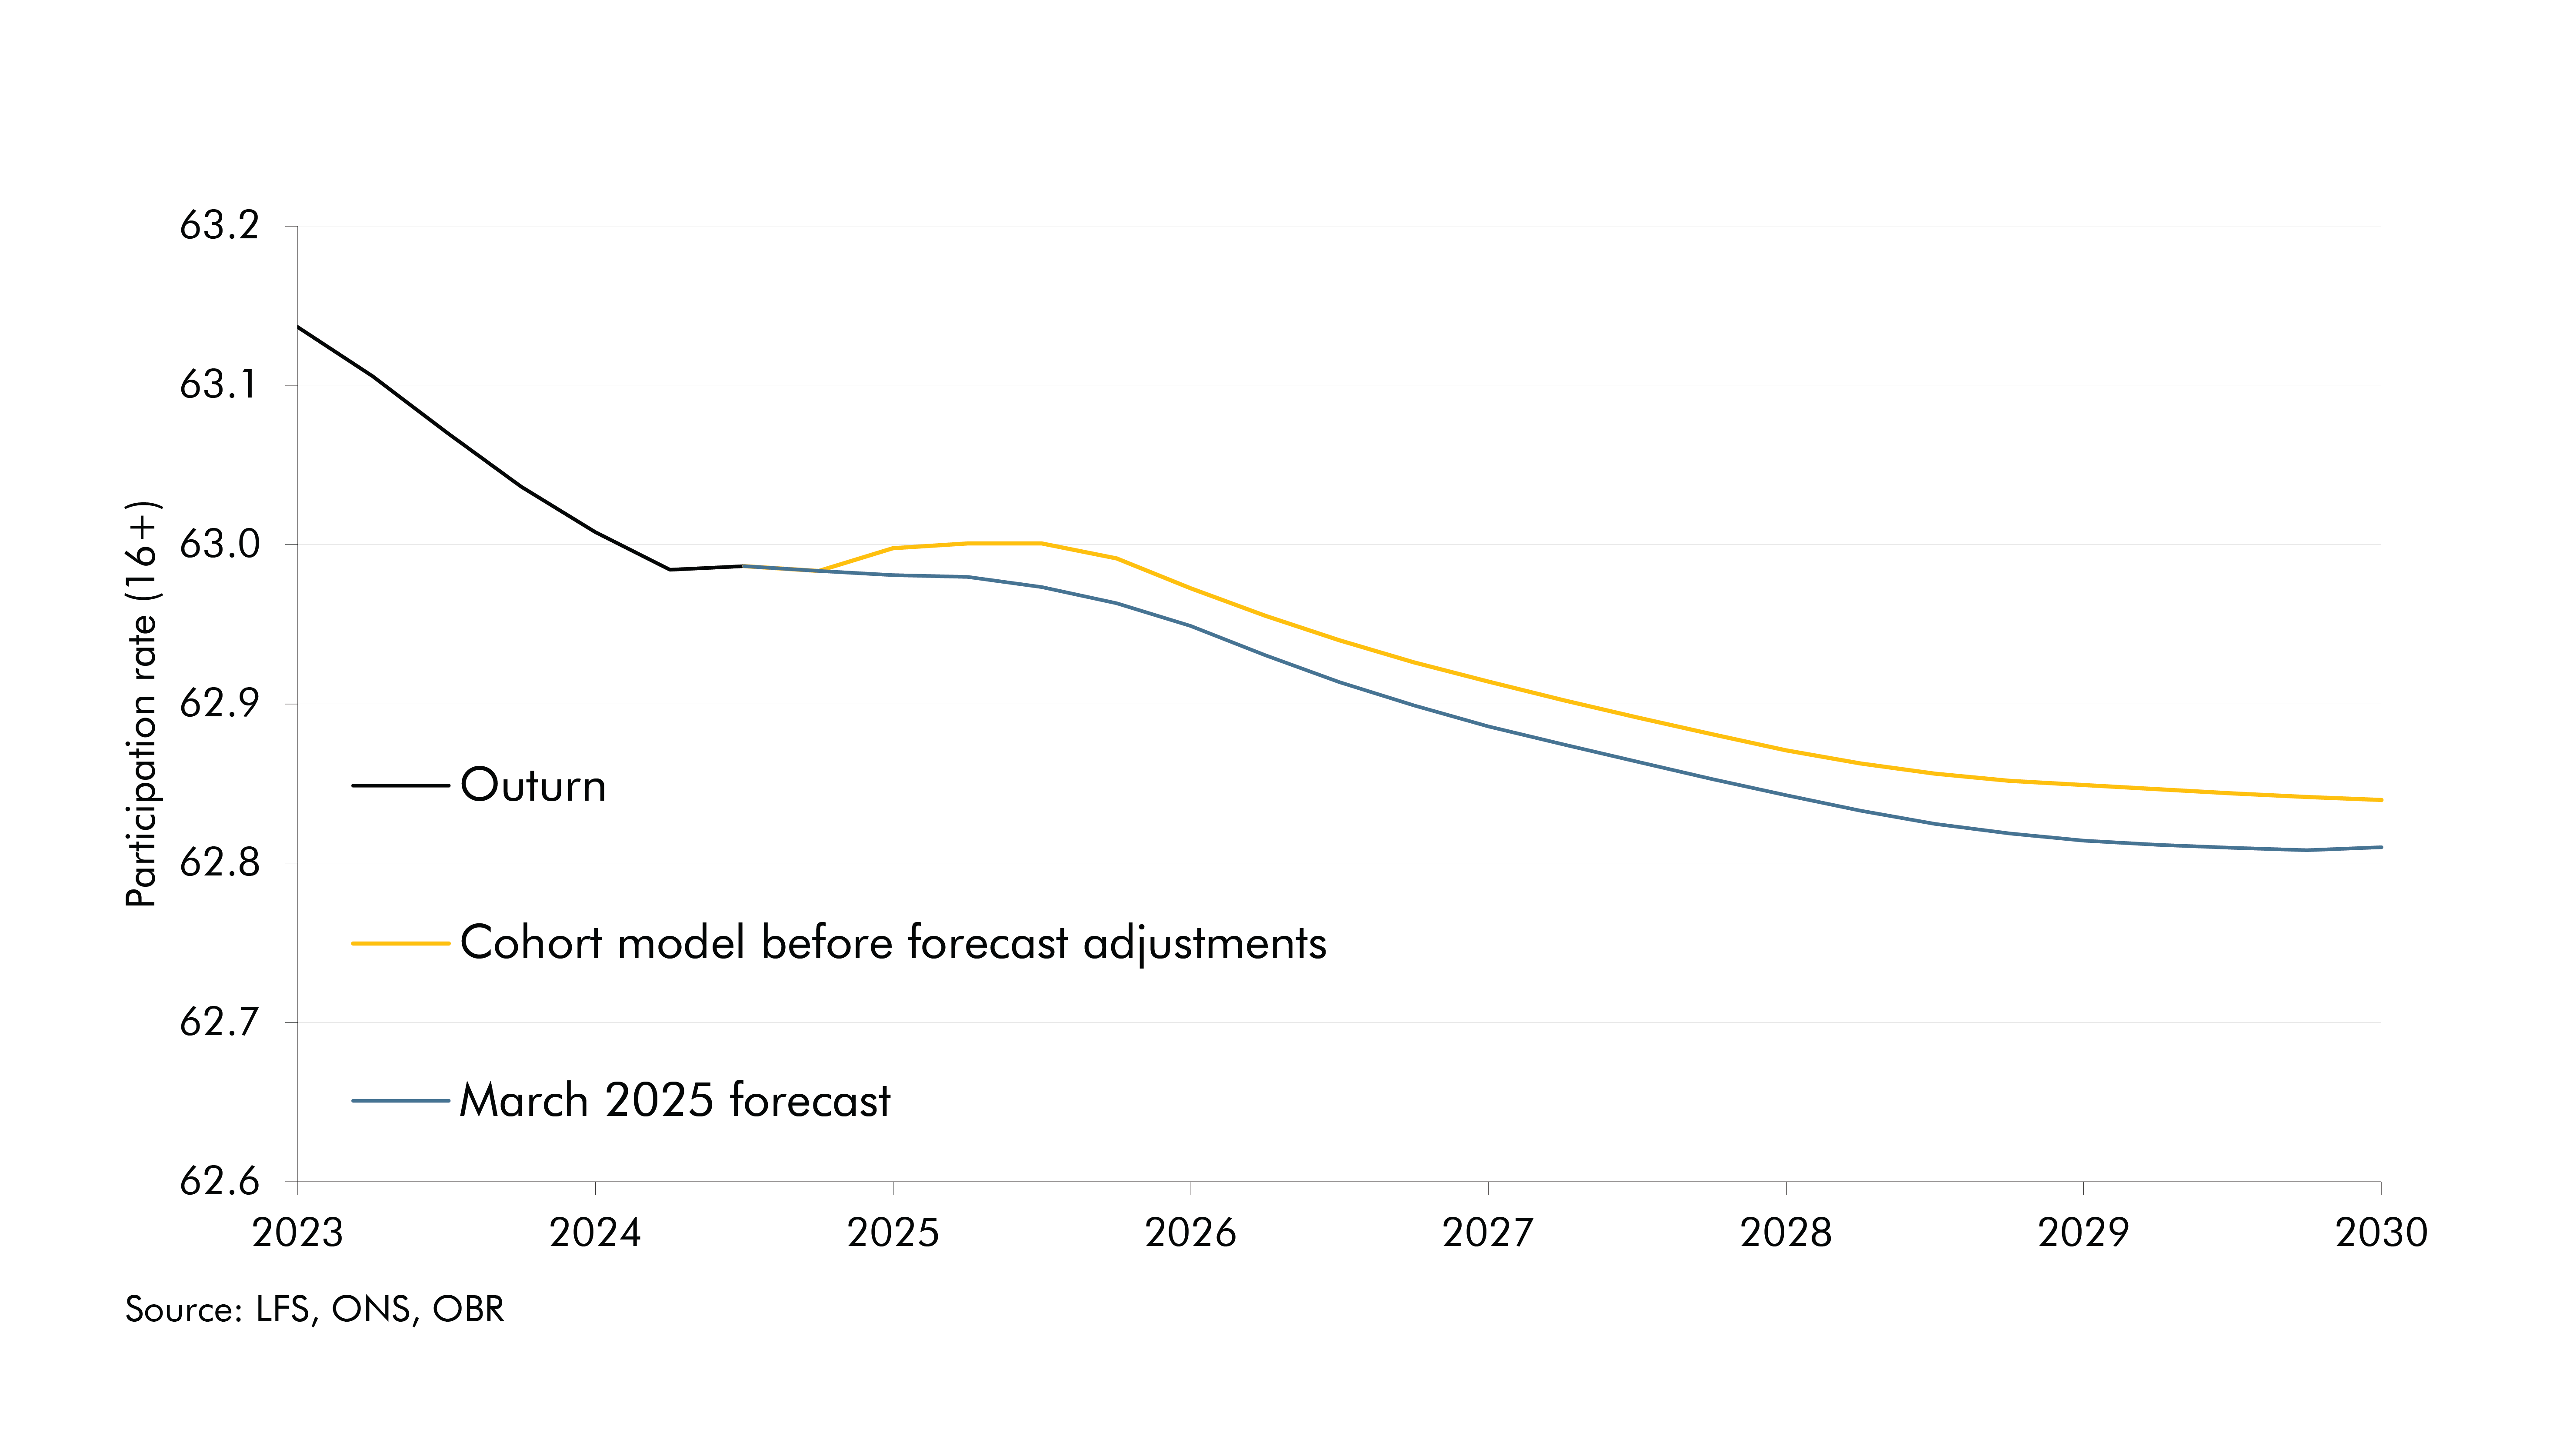
Chart 3 (yellow line) shows that the cohort model outputs underpinning our March 2025 forecast implied a declining potential participation rate over the next five years. This is driven primarily by the steady ageing of the population, with the share of the population aged over 60 rising from 25 per cent in 2022 to 27 per cent in 2029 There is also a contribution from inactivity due to long-term sickness, where the underlying LFS data used to calculate entry and exit rates result in the implied participation rate for those aged 50-64 remaining below its pre-pandemic level over the forecast. This is consistent with the forecast for a further rise in incapacity benefits caseloads. The previously discussed increase in the state pension age from 66 to 67 between 2026 and 2028 provides a partial offset to these factors.
To construct our final potential participation rate forecast in March (blue line), we layered further judgements on top of the cohort model output. First, a further decline in inactivity due to caring for young children, because of falling birth rates and policy measures to increase childcare provision. Second, an adjustment to the participation rate for new migrants, to reflect their slightly lower participation rates for a given age (though new migrants push up on participation overall as they are much more likely to be of prime working age). And third, in our post-measures forecast, we layered on a small negative impact from changes in policy since our previous forecast in Autumn 2024.
By undertaking top-down sense checks of aggregated age groups and adjusting the entry and exit rates based on expected future behaviour, our final forecast balances a comprehensive view of both demographics and other factors that influence potential participation.
Chart 3: March 2025 EFO potential participation rate forecast
A set of cohort model outputs covering participation rates, participation levels and population levels by single year of age, consistent with our March 2025 Economic and fiscal outlook are available in the downloads section.
Annex A: Entry and exit rates


Annex B: State pension age changes


![For those nearing retirement, we can rewrite the above formula as the entry rate given by P(〖ent〗^(x+1) ) is assumed to zero as: 〖PR〗_(t+1)^(x+1)=〖PR〗_t^x- P(〖ext〗^(x+1) )⋅〖PR〗_t^x Where we introduce P(〖ext〗^(x+2) ) to account for both the exit rate before and after the SPA change which are weighted by the parameter w. 〖PR〗_(t+1)^(x+1)=〖PR〗_t^x- (1-w)⋅[P(〖ext〗^(x+1) )⋅〖PR〗_t^x ]-⋅[P(〖ext〗^(x+2) )⋅〖PR〗_t^x ] Where w: w(a,y){■(1, @0, @min〖[1,min(max(min(∆a-∆y+1 ,9),0),9)/max(min(3+∆a ,9),3) ] 〗 )■(if a<a_r-10@if a≥a_r-10 and ∆y>∆a@if a≥a_r-10 and ∆y≤∆a■(∆@∆)) } And a=current age, a_r=retirement age, y=projection year, y_r=start of state pension implementation, ∆y= y_r-y, ∆a= a_r-a](./assets/jYcb7146Zi/annex-b-equations_increased-spacing_march-update.png)
Acknowledgements
We are grateful for the engagement, expertise, and insights from various OBR staff members in compiling this article.
Downloads
Forecasting participation trends: the cohort model (article PDF)
OBR cohort model tables (excel)