

Estimating the yield from tax compliance policies


This article sets out how the OBR is developing its approach to scrutinising and assessing compliance measures, and further work we plan to do in this area.
Introduction


At each fiscal event, governments typically announce a number of new measures aimed at reducing tax non-compliance and thereby boosting overall tax revenues. As with all new policy measures, the OBR is required by legislation to scrutinise the estimates of the expected yield from these policies, which are produced by analysts in HM Revenue and Customs (HMRC). Once we are content the estimates are reasonable and central, we certify them and include their yield in our fiscal forecasts.
There is often a high level of uncertainty around the estimates of the yield from these measures, as well as challenges in ascertaining whether this yield is additional to our baseline tax revenue forecasts. Policies seeking to address a specific form of non-compliance often target complex areas of the tax system, can involve changes to HMRC’s internal administrative arrangements and procedures, and are likely to lead some portion of the targeted non-compliant taxpayers to change behaviour. The scale and impact of such behavioural change is typically difficult to predict. The yield from more general programmes which increase HMRC’s overall resourcing of compliance staff is subject to uncertainties such as the speed at which new staff can be recruited and trained, the type of compliance activity they will target in future, and the estimated average tax yield that new staff members will deliver over time.
Given these issues we have been working with HMRC and HM Treasury to develop the approaches we use to scrutinise and assess compliance measures. This article sets out recent progress and summarises the further work we plan to do in this area.
Developing a projection of the tax gap


The overall tax gap measures the difference between the tax collected by HMRC and theoretical tax liabilities. It is therefore a measure of the overall level of non-compliance in the tax system. HMRC has for some time published regular estimates of the past tax gap. We have been working with HMRC to supplement this with projections of the tax gap over the forecast period. This will allow us to assess from a top-down perspective whether, after taking account of the estimated impact of new compliance measures announced at a fiscal event, the path of the tax gap over the forecast looks reasonable in comparison to recent trends. By combining this with the bottom-up scrutiny we undertake of each individual compliance measure, described above, we can better assure ourselves that the yield from new compliance measures announced at a fiscal event looks reasonable and central.
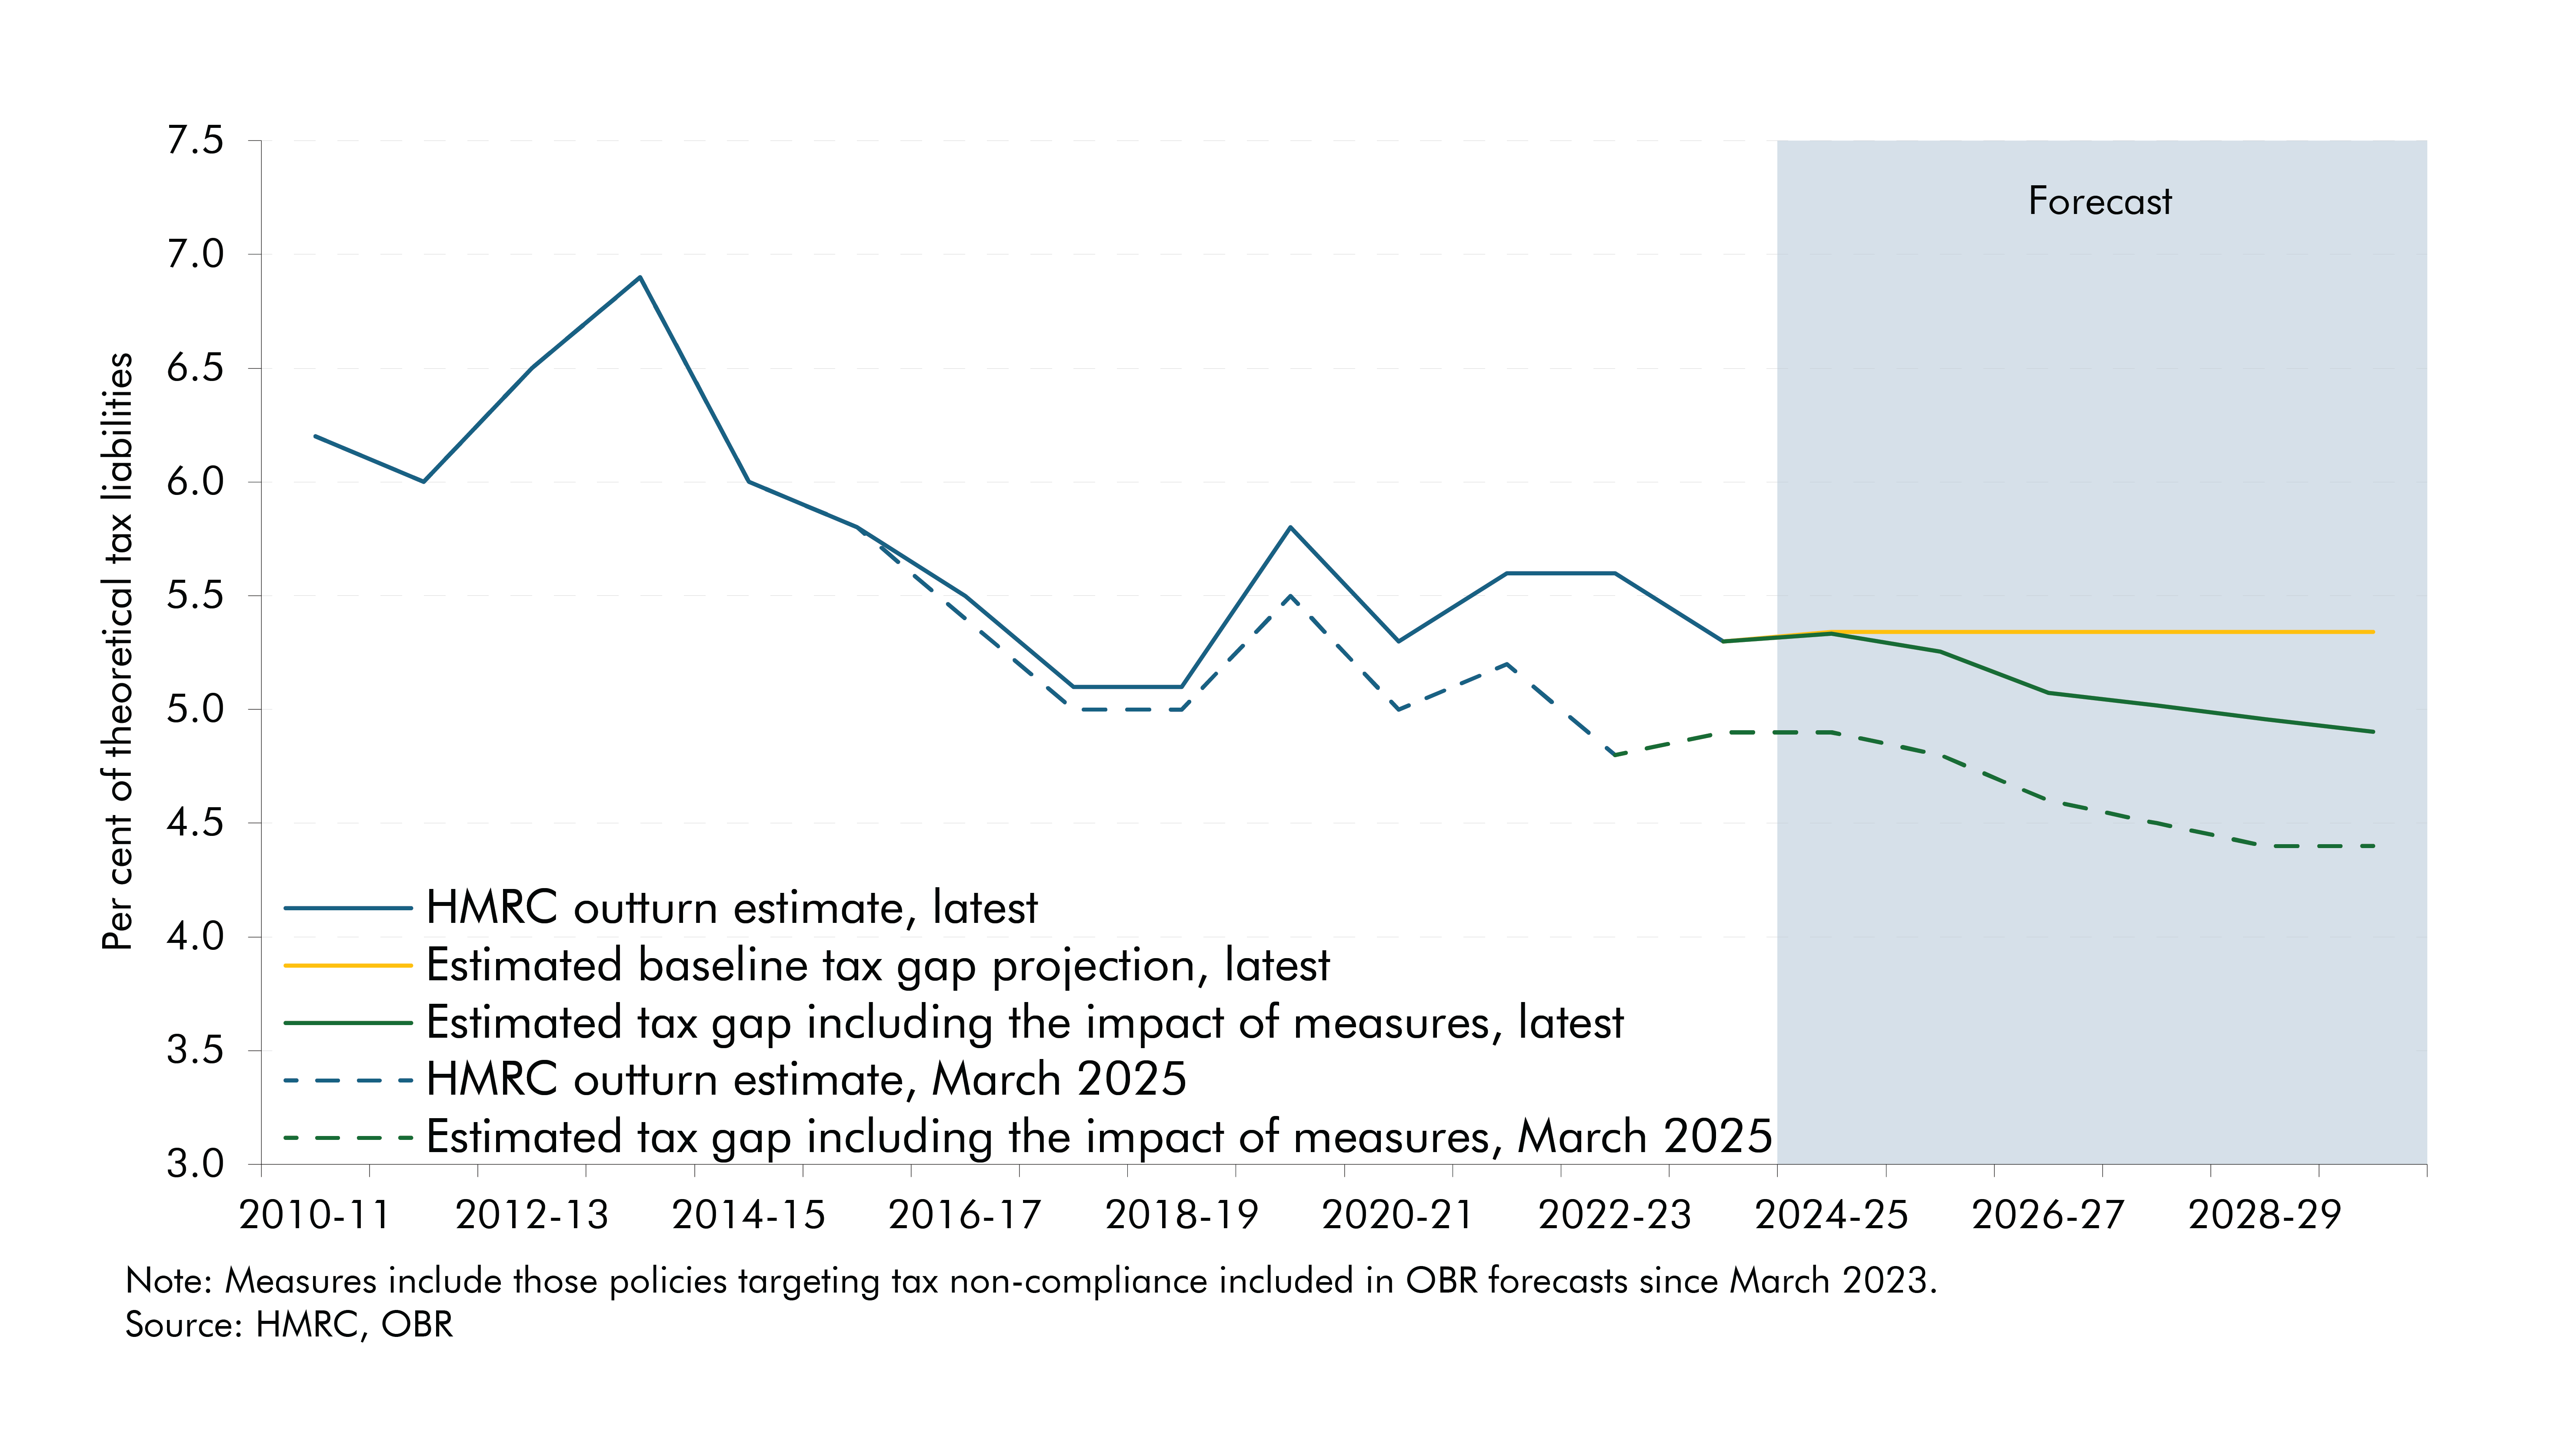
HMRC’s most recent outturn tax gap estimates included upward revisions to the past tax gap, measured as a share of theoretical tax liabilities, including a revision of 0.8 percentage points in 2022-23. As shown in Chart 1, this means that the outturn tax gap has now been flat since 2017-18, compared to the previous estimates, produced by HMRC in June 2024, which suggested a slight decline in the most recent years. A significant source of recent upward pressure on the overall tax gap has come from the tax gap attributed to small businesses, which has increased from 48 per cent of the overall tax gap in 2019-20 to 60 per cent in 2023-24. HMRC emphasises in its publication that measuring the outturn tax gap is complex and uncertain, and states that improvements in measurement and revisions to underlying data sources have made a significant contribution to the revisions in the latest estimates.
Chart 1 also shows a preliminary projection we have produced with HMRC of the cumulative effect of new compliance policies announced since the March 2023 fiscal event on the tax gap over the forecast period. This suggests that together these measures are expected to reduce the tax gap by 0.4 percentage points by 2029-30. The most recent revisions to the outturn tax gap described above, which reinforce the flat trend over the past decade, suggest that the decline in tax gap implied by recent measures looks more challenging to achieve than it did at the time of the March forecast.
Chart 1: HMRC tax gap as a share of theoretical tax liabilities

This projection does not currently include yield from HMRC debt collection measures.1 HMRC has been developing a modelling approach to include the yield from such measures, which we will then incorporate into the analysis. This is important because recent governments have announced a number of substantial programmes aimed at increasing debt collection at recent fiscal events. Initial estimates show that approximately 12 per cent of the additional tax revenue recovered through debt measures announced since March 2023 leads to a reduction in the tax gap. The remainder is tax revenue that is received more quickly than would otherwise be the case due to an acceleration of the collection of debt.
Assessing baseline compliance trends


The post-measures projection in Chart 1 is compared to an illustrative baseline which assumes that without the impact of new measures the tax gap would remain flat over the forecast period. This is based on an estimate of ‘baseline’ compliance yield, which is the expected yield from HMRC compliance activities before taking account of additional specific measures. HMRC’s tax gap methodology assumes that achieving this baseline compliance yield will generate a flat tax gap.
We intend to undertake further work with HMRC to develop the methodology used to produce this baseline projection. This will include looking in more details at the factors which will drive baseline non-compliance including the size and composition of the tax base, the complexity of the tax system, the resource that HMRC allocates to supporting taxpayers and tackling non-compliance, and also wider economic and societal trends. For example, in projecting baseline fraud and error in the welfare system, the Department for Work and Pensions assumes that there is increasing prevalence of fraud and error in society.
HMRC’s current projections assume that target baseline compliance yield will rise by 42 per cent, from £32.6 billion in 2023-24 to £46.3 billion in 2029-30. Table 1 breaks down this growth in baseline compliance into two drivers: value growth, which is due to the value of cases each increasing over time as tax revenues increase in cash terms; and volume growth, which is due to the expected increase in the numbers of taxpayers over the period. HMRC’s modelling assumes that value growth can be delivered without additional resourcing, as caseworkers will bring in more additional tax revenue per case. However, meeting volume growth is assumed to generally require either greater numbers of HMRC compliance officers or increased productivity.
Table 1: Baseline compliance outturn and forecast
|
£ billion |
|||||||||
|---|---|---|---|---|---|---|---|---|---|
|
2023-24 |
2024-25 |
2025-26 |
2026-27 |
2027-28 |
2028-29 |
2029-30 |
|||
|
Baseline compliance yield1 |
32.6 |
34.0 |
36.5 |
38.9 |
41.2 |
43.7 |
46.3 |
||
|
Change from 2023-24 |
1.4 |
3.9 |
6.3 |
8.6 |
11.1 |
13.7 |
|||
|
of which: |
|||||||||
|
Value growth |
0.9 |
1.9 |
2.8 |
3.8 |
4.8 |
5.7 |
|||
|
Volume growth |
0.4 |
2.0 |
3.4 |
4.8 |
6.3 |
7.9 |
|||
|
1 These are initial HMRC baseline compliance target yield estimates which will be subject to further scrutiny and potential revision. |
|||||||||
|
Source: HMRC |
|||||||||
HMRC’s current plan is to deliver this volume growth over the period to 2029-30 through productivity improvement rather than through increases in staff. HMRC’s funding allocation from 2026-27 to 2028-29 was announced at the Spending Review in June 2025, but specific allocations, including compliance funding, are yet to be finalised. The Treasury has made a commitment to provide the funding required for HMRC to achieve this baseline compliance yield target, and should HMRC assess that further funding is required, this will be allocated as part of the Autumn Budget. We will therefore continue to assess both the provision of funding and HMRC’s plans to deliver these productivity gains, so that we can be assured that the baseline compliance yield which underpins the tax gap projection is reasonable and central.
Future areas of work


This article has set out some of the issues we are considering in our work to enhance our assessment of tax compliance measures. Our next steps in this area will be to:
- Reassess the projections of baseline compliance revenue once HMRC’s more detailed funding allocations and delivery plans are finalised in the autumn.
- Assess in more detail the wider drivers of compliance yield and whether they are consistent with the current assumption that the baseline tax gap will remain flat in future, before the impact of new measures.
- Develop the projections of the impact of specific new policies on the tax gap, by incorporating debt measures and including measures announced prior to 2023.
- In parallel, develop the ‘bottom-up’ methodologies we use to assess individual new compliance measures, including through using evidence from evaluations of the effectiveness of recent measures.
Acknowledgements
We are grateful for the engagement, expertise, and insights from various OBR staff members, HMRC, and HM Treasury colleagues in compiling this article.
Downloads
Estimating the yield from tax compliance policies (article PDF)